
FIGURE 5.
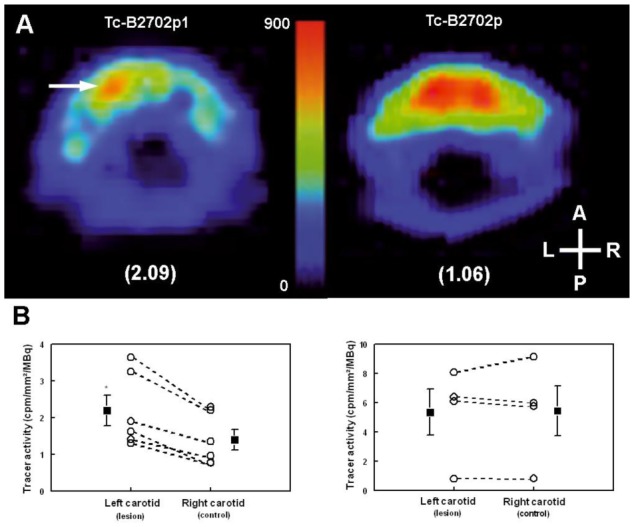
A, Representative pinhole SPECT image of Tc-B2702p1 (left) and 99mTc-B2702p (right) activity at the level of the atherosclerotic lesion developing at the site of left carotid artery ligation in an apoE−/− mouse. The corresponding left-to-right carotid tracer activity ratios are indicated in parenthesis; B, Left & right Tc-B2702p1 (left) and 99mTc-B2702p (right) carotid activities from in vivo pinhole SPECT image quantification. *, P<0.05 vs. right carotid tracer activity.