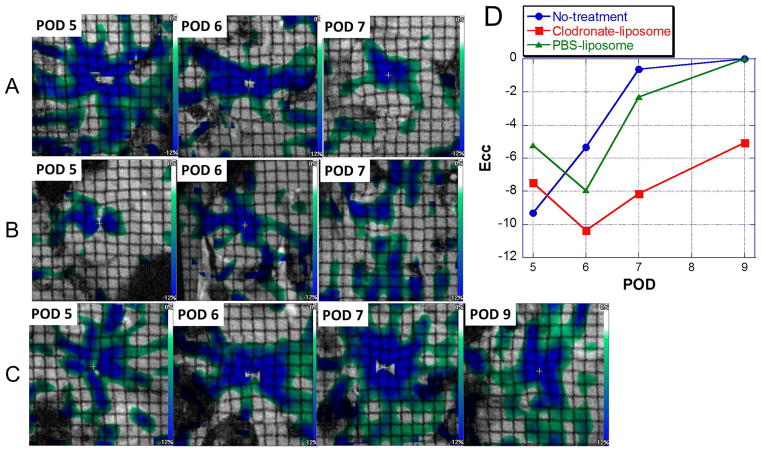
Figure 6.
Circumferential strain (Ecc) maps of the same allograft hearts over time, derived from tagging MRI for (A) a no-treatment allograft heart; (B) a PBS-liposome treated allograft heart; and (C) a clodronate-liposome treated allograft heart. (D) Mean Ecc values across the LV wall of the individual hearts shown in A, B, and C, on each POD. Blue circles: the no-treatment control allograft heart; red squares: the clodronate-liposome treated allograft heart; and green triangles: the PBS-liposome treated allograft heart.

