
Figure 4.
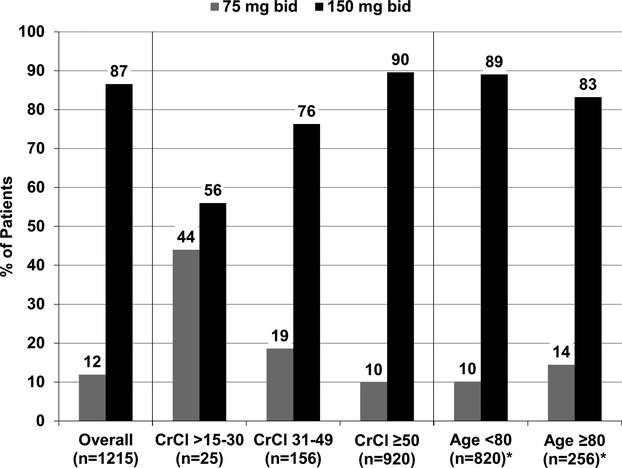
Distribution of dabigatran dosing overall and in high‐risk subgroups. Numbers may not sum to 100% due to reporting of other dosing regimens. *Excludes patients with CrCl <30 mL/min per 1.73 m2. CrCl indicates creatinine clearance calculated by the Cockcroft‐Gault formula.13