
Figure 4.
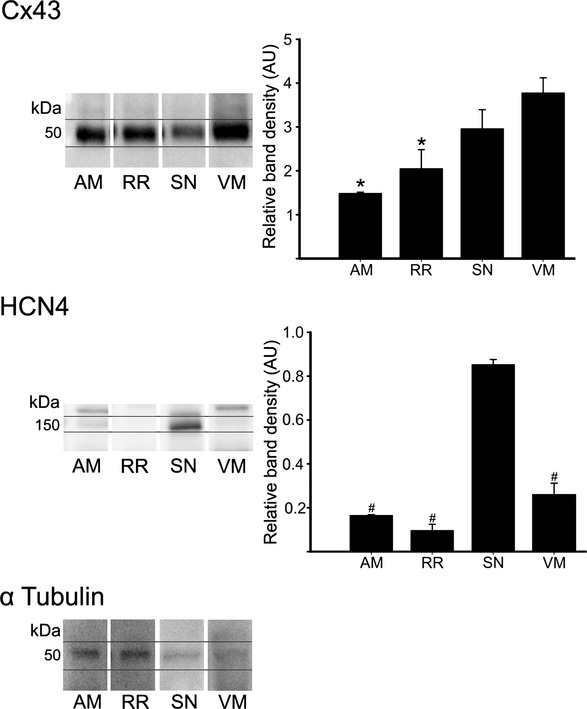
Western blot showing protein expression of Cx43 (top), HCN4 (middle), and α‐tubulin (bottom). Cx43 and HCN4 band density normalized to α‐tubulin presented in graphs. *P<0.05 vs VM; #P<0.05 vs SN. AM indicates atrial muscle; RR, right ring; SN, sinus node; VM, ventricular muscle.