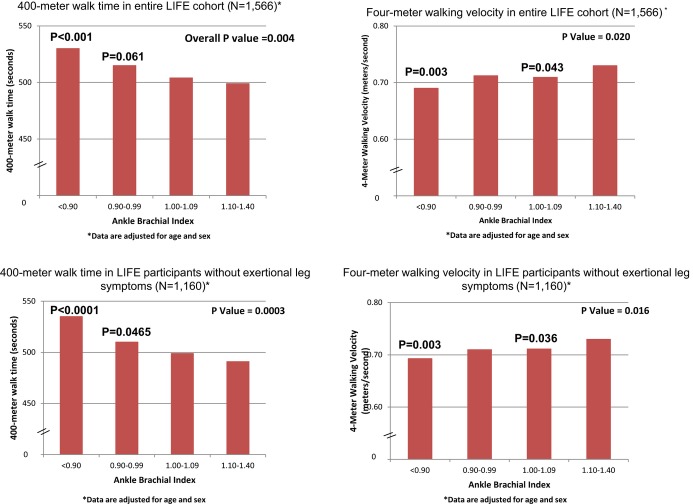
Figure 1.
Age and sex adjusted least square mean values for 400‐meter walk time and 4‐m walking velocity among LIFE Study participants according to their ankle brachial index. *Analyses are adjusted for age and sex. P values shown above individual bars represent statistically significant differences between the ABI group indicated compared with participants with ABI of 1.10 to 1.40. ABI indicates ankle brachial index; LIFE, Lifestyle Interventions and Independence for Elders.

