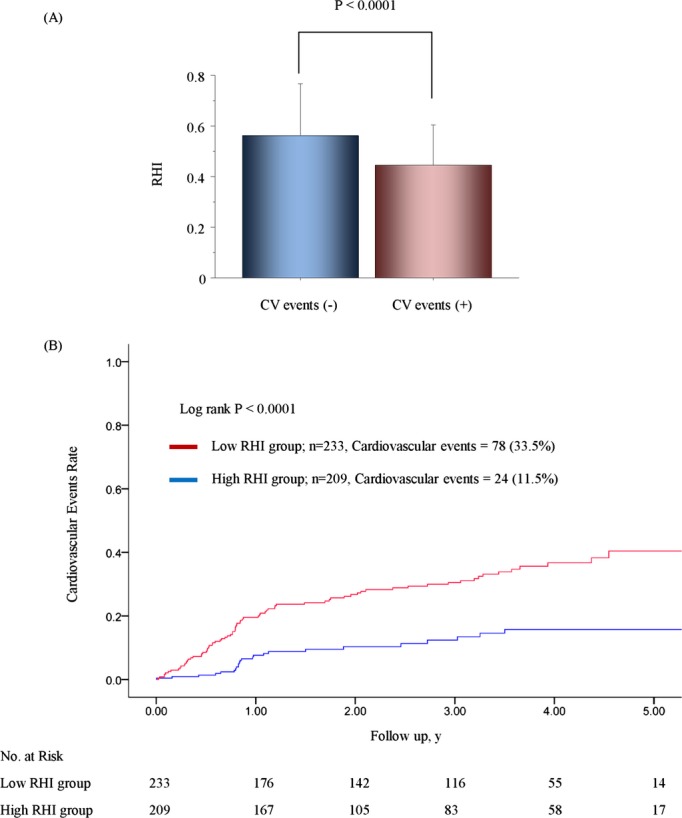
Figure 5.

RHI and cardiovascular events in 442 CAD patients. A, These bars represent averages of the RHI in each group (CV events [−] [n=340], CV events [+] [n=102]). T‐bars indicate standard deviation. B, Kaplan‐Meier analysis for the probability of cardiovascular events in CAD patients based on median value of RHI (0.501). CAD indicates coronary artery disease; CV, cardiovascular; RHI, reactive hyperemia‐peripheral arterial tonometry index.
