
Figure 1.
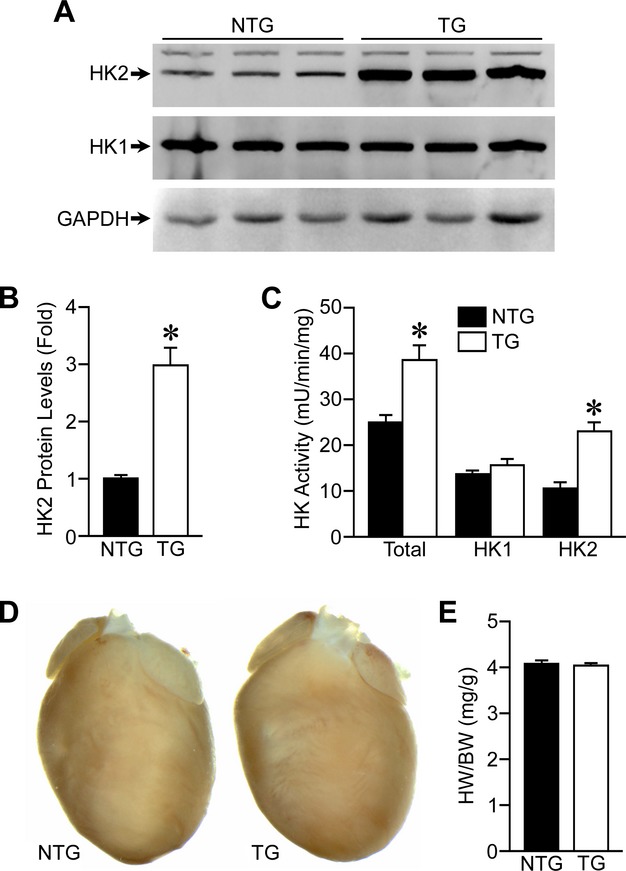
Characterization of αMHC‐HK2 transgenic mice. A, Western blotting for HK2 and HK1 protein levels in αMHC‐HK2 non‐transgenic (NTG) and transgenic (TG) whole‐heart lysates. Glyceraldehyde 3‐phosphate dehydrogenase (GAPDH) was used as a loading control. B, Quantification of HK2 protein expression in NTG and TG hearts (n=6). C, Total (HK1 and HK2), HK1, and HK2 enzymatic activities in whole heart lysates from NTG and TG mice (n=4). D, Representative heart images from NTG and TG mice. E, Gravimetric analysis of heart weight/body weight ratio (HW/BW) for NTG and TG mice (n=26 to 30). Error bars represent SEM with *P<0.05 vs NTG. αMHC‐HK2 indicates α‐myosin heavy chain hexokinase‐2; SEM, standard error of the mean.