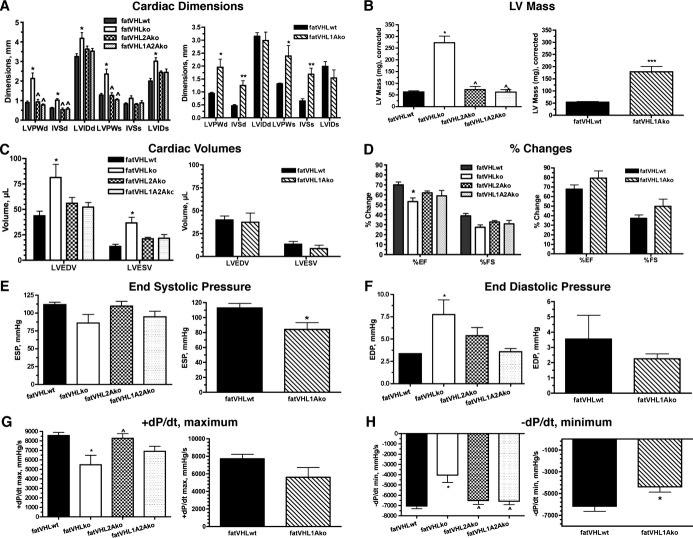
Figure 7.
Echographic and in vivo hemodynamic analyses reveal cardiac dysfunction in fatVHLko and fatVHL1Ako mice. Procedures were performed on lightly anesthetized mice at ≈8 weeks of age, except that fatVHL1Ako and their WT littermates were at 4 weeks of age. For statistical analysis of multiple data groups (left panels), 1‐way ANOVA was used with post hoc Dunnett'e multiple comparison test. Student's t‐test was used for 2‐group comparison (right panels). Echocardiography is shown in A through D with n=9 for fatVHLwt, n=7 for fatVHLko, n=4 each for fatVHL2Ako and fatVHL1A2Ako. For fatVHL1Ako comparison, n=5 each for fatVHL1Ako and fatVHLwt. A, Cardiac dimensions: LVPW, left ventricle posterior wall; IVS, interventricular septum; LVID, left ventricle internal dimension; d, diastolic; s, systolic. Left panel: P<0.02 (1‐way ANOVA) for each group except IVSs, *P<0.05 vs fatVHLwt and ^ vs fatVHLko. Right panel: *P<0.05 and **P<0.01 for fatVHL1Ako vs fatVHLwt. B, Left ventricle (LV) mass. For the left panel, P<0.0001 (1‐way ANOVA) with significant difference vs fatVHLwt (*) or vs fatVHLko (^). For the right panel comparing fatVHL1Ako to fatVHLwt, ***P<0.001 (t‐test). C, Cardiac volumes (LVEDV, LV end diastole volume and LVESV, LV end systole volume). For the left panel, P<0.02 (1‐way ANOVA). D, Changes in ejection fraction (EF) and fractional shortening (FS). For the left panel, P<0.01 (%EF, 1‐way ANOVA) and *P<0.05 vs fatVHLwt. Hemodynamic analysis (catheter) is shown in E through H with n=8 for fatVHLwt, n=6 for fatVHLko, n=9 for fatVHL2Ako, n=6 for fatVHL1A2Ako, n=4 for fatVHL1Ako, and n=5 for fatVHLwt. E, End systolic pressure (ESP). For the left panel, P=0.065 (1‐way ANOVA). For the right panel comparing fatVHL1Ako to fatVHLwt, ***P<0.05 (t‐test). F, End diastolic pressure (EDP). For the left panel, P=0.01 (1‐way ANOVA) and *P<0.05 vs fatVHLwt. G, Positive pressure changes during heart cycles (+dP/dt maximum). For the left panel, P<0.005 (1‐way ANOVA), *P<0.05 vs fatVHLwt and ^P<0.05 vs fatVHLko. H, Negative pressure changes (−dP/dt minimum). For the left panel, P<0.001 (1‐way ANOVA), *P<0.05 vs fatVHLwt and ^P<0.05 vs fatVHLko. For the right panel comparing fatVHL1Ako to fatVHLwt, *P<0.05 (t‐test). KO indicates knockout; VHL, von Hippel–Lindau; WT, wild type.

