
Figure 3.
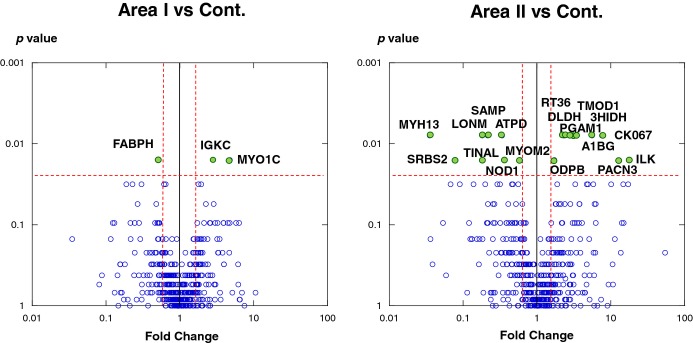
Differential levels of protein in acute myocardial infarction (AMI) and control tissues. Protein expression was compared between area I and control (left) and area II and control (right). Each point represents an individual protein. Vertical line represents 1.5‐fold change, and horizontal line denotes P=0.025 (Mann–Whitney U test followed by Bonferroni's correction). The most prominent proteins (P<0.025 and negative fold‐change <−1.5 or 1.5 <positive fold‐change) are labeled with their UniProt entry name. 3HIDH indicates 3‐hydroxyisobutyrate dehydrogenase; A1BG, alpha‐1B‐glycoprotein; ATPD ATP synthase subunit delta; DLDH, dihydrolipoyl dehydrogenase; FABPH, fatty acid–binding protein, heart (H‐FABP); IGKC, Ig kappa chain C region; ILK, integrin‐linked protein kinase; LONM, Lon protease homologue; MYH13, myosin heavy‐chain 13; MYO1C, myosin 1; MYOM2, myomesin‐2; ODPB, pyruvate dehydrogenase E1 component subunit beta; PACN3, protein kinase C and casein kinase substrate in neurons protein 3; PGAM1, phosphoglycerate mutase 1; SAMP, serum amyloid P‐component; SRBS2, sorbin and SH3 domain‐containing protein 2 (SORBS2); TINAL, tubulointerstitial nephritis antigen‐like; TMOD1, tropomodulin‐1.