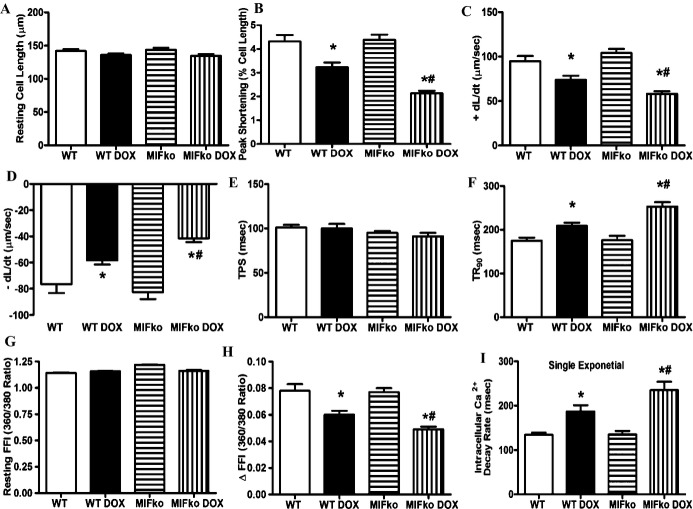
Figure 3.
Cardiomyocyte contractile and intracellular Ca2+ handling properties in WT and MIF−/− mice 7 days after doxorubicin (DOX) injection. A, Resting cell length; B, peak shortening (PS, normalized to resting cell length); C, maximal velocity of shortening (+dL/dt); D, maximal velocity of relengthening (−dL/dt); E, time‐to‐PS (TPS); F, time‐to‐90% relengthening (TR90); G, resting fura‐2 fluorescence intensity (FFI); H, electrically stimulated rise in FFI (∆FFI); I, single exponential intracellular Ca2+ decay rate. Mean±SEM, n=100 to 130 cells from 5 mice per group, *P<0.05 vs WT group, #P<0.05 vs WT DOX group. ko indicates knockout; MIF, macrophage migration inhibitory factor; WT, wild type.

