
Figure 6.
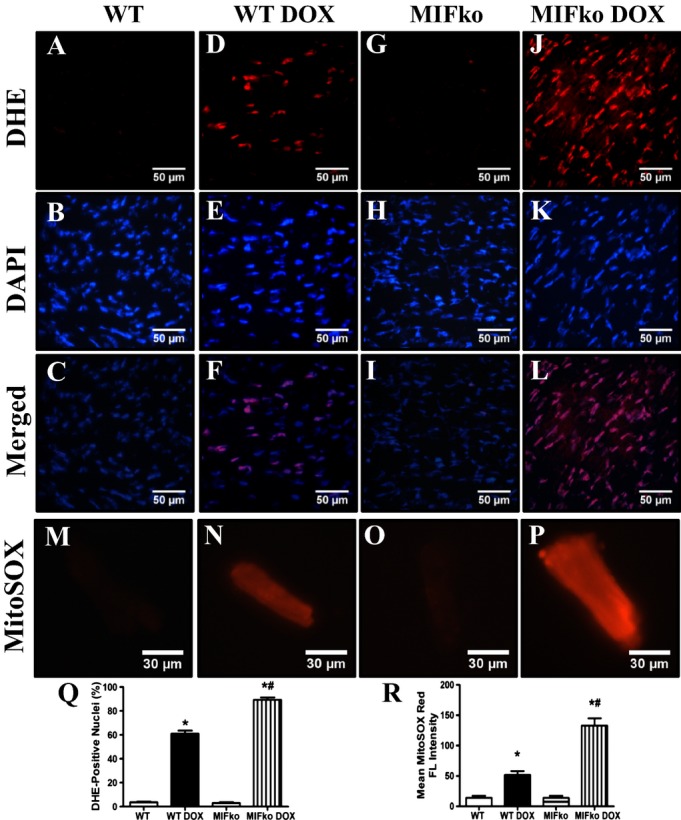
ROS production in hearts and myocardial mitochondria from WT and MIF−/− mice treated with saline or doxorubicin (DOX). A through L, Frozen myocardial tissue sections from WT and MIF−/− mice treated with saline or DOX were stained with DHE (red) and nucleus with DAPI (blue). Representative images of heart sections from WT and MIF−/− mice stained with DHE and DAPI. Oxidized DHE intercalates into DNA and the nuclei appear in red; M through P, Representative images of MitoSOX‐stained cardiomyocytes from WT and MIF−/− mice treated with or without DOX. Data were from 3 independent experiments each with 3 mice per group (for a total of 9 mice per group); Q, Quantitative analysis of DHE‐positive nuclei 7 days after DOX injection (≈50 fields from 3 mice per group); R, MitoSOX red fluorescence intensity. Mean±SEM, n=50 fields per group, *P<0.05 vs WT group, #P<0.05 vs WT DOX group. DHE indicates dihydroethidium; DAPI, 4′,6‐diamidino‐2‐phenylindole; ko, knockout; MIF, macrophage migration inhibitory factor; MitoSOX, the brand name of the reagent used for mitochondrial superoxide staining; WT, wild type.