
Figure 4.
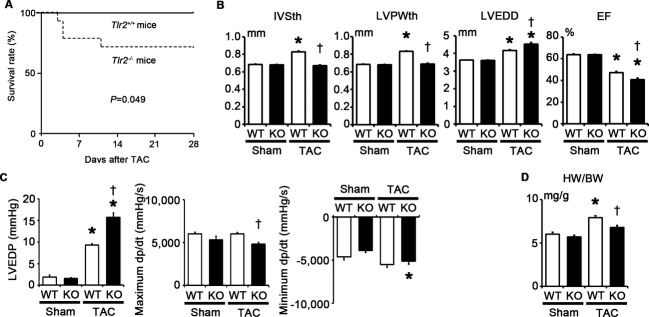
Impact of TLR2 deficiency on pressure overload–induced cardiac hypertrophy at 28 days after TAC. A, Survival curve of Tlr2+/+ and Tlr2−/− mice after TAC produced with a 25‐gauge needle. Continuous line, Tlr2+/+ mice (n=12); dotted line, Tlr2−/− mice (n=14). P=0.049 for the log‐rank test. B, Echocardiographic parameters (n=6). C, Hemodynamic data (n=5). Hemodynamic measurement was performed by cannulating the micro–pressure transducers into the left ventricle through the right carotid artery. D, Heart weight (HW) –to–body weight (BW) ratios (n=6). WT, Tlr2+/+ mice; KO, Tlr2−/− mice. *P<0.05 vs sham; †P<0.05 vs Tlr2+/+ mice. EF indicates ejection fraction; IVSth, interventricular septum thickness; LVEDD, left ventricular end‐diastolic diameter; LVEDP, left ventricular end‐diastolic pressure; LVPWth, left ventricular posterior wall thickness; TAC, transverse aortic constriction; TLR, Toll‐like receptor; WT, wild‐type.