
Figure 2.
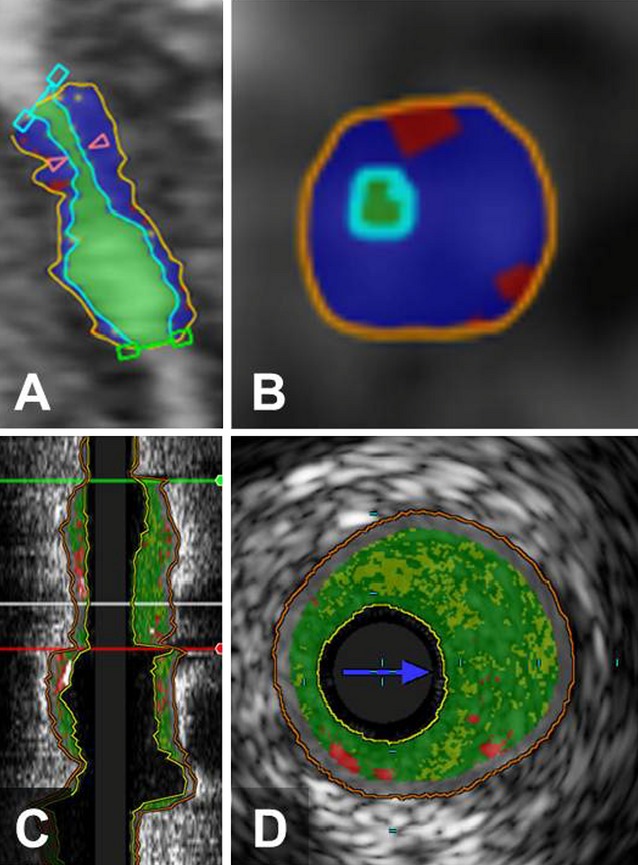
Example of CTA and IVUS/VH analysis of coronary arterial lesions. Long‐axis (A) and short‐axis (B) views of coronary plaques by CTA, demonstrating the lumen (light green), high‐density noncalcified plaque (blue), and low‐density noncalcified plaque (red). Corresponding long‐axis (C) and short‐axis (D) views of the same lesion by IVUS/VH, demonstrating fibrous tissue (dark green), fibrofatty tissue (light green), necrotic core (red), and calcium (white). CTA indicates computed tomography angiography; IVUS/VH, intravascular ultrasound virtual histology.