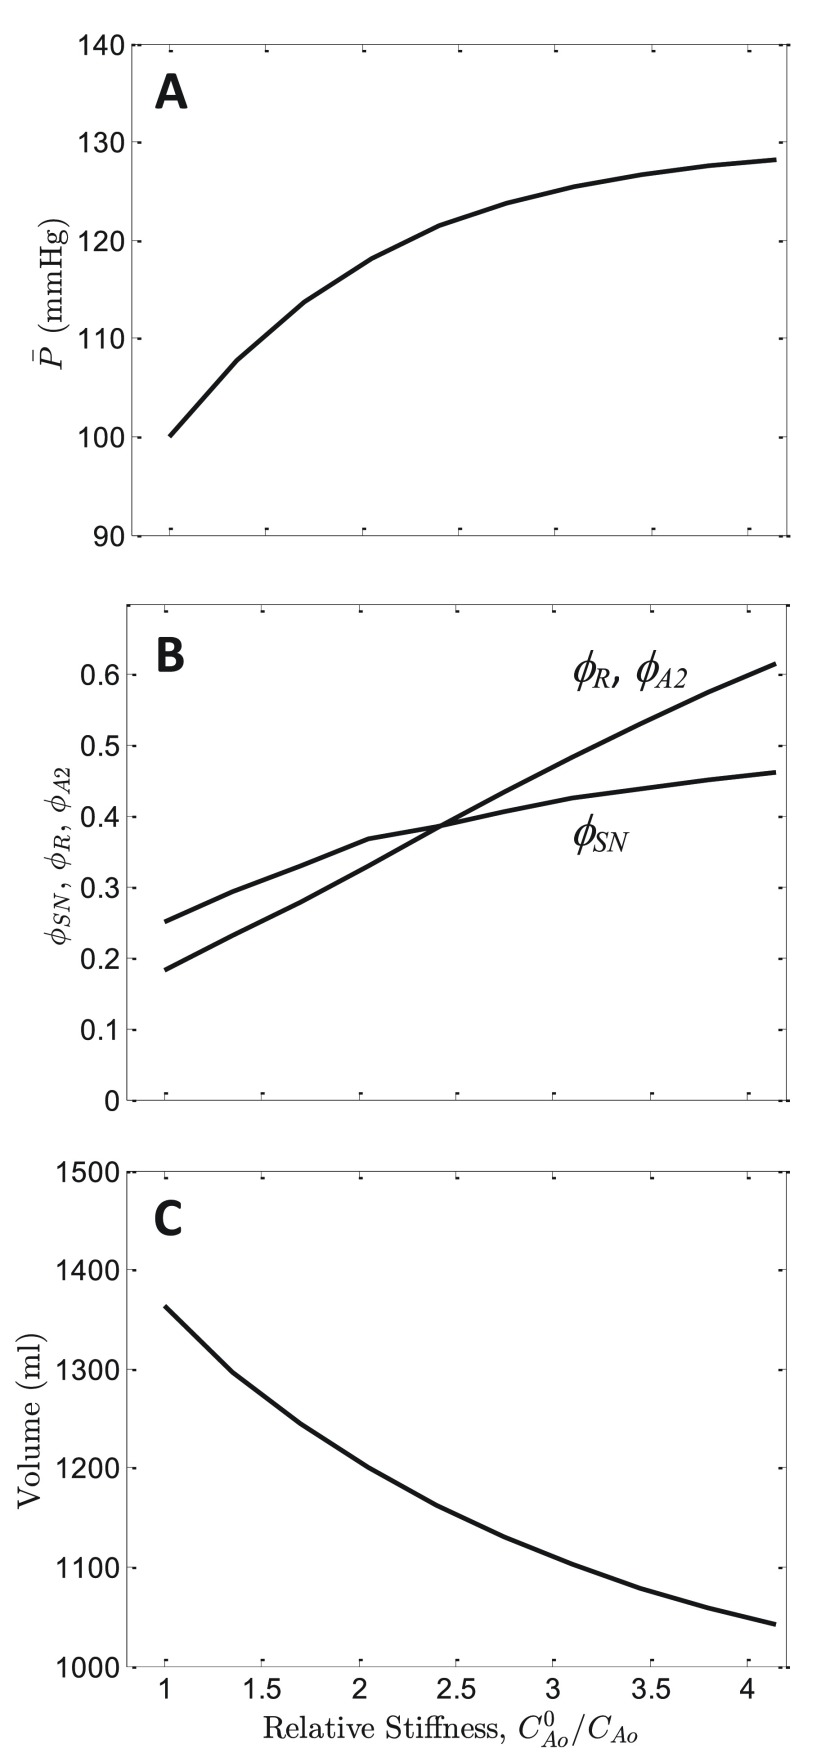
Figure 10. Effects of arterial stiffening on mean pressure.
A. The model predicted for the steady-state mean arterial pressure is plotted as a function of relative aortic stiffness, C Ao 0/ C Ao, where C Ao 0 is the baseline normal value of aortic compliance, and C Ao is the value used to obtain the simulated pressure. As stiffness is increased (as compliance is decreased), predicted mean pressure increases. Calculations assume normal salt/volume loading, Q in = 0.5835 ml min -1, resulting in a mean pressure of 100 mmHg at C Ao 0/ C Ao = 1. B. Model-predicted steady-state sympathetic tone ϕ SN, plasma renin activity ϕ R, and angiotensin-II activity ϕ A2 are plotted as functions of C Ao 0/ C Ao. C. Predicted blood volume is plotted as a function of C Ao 0/ C Ao.

