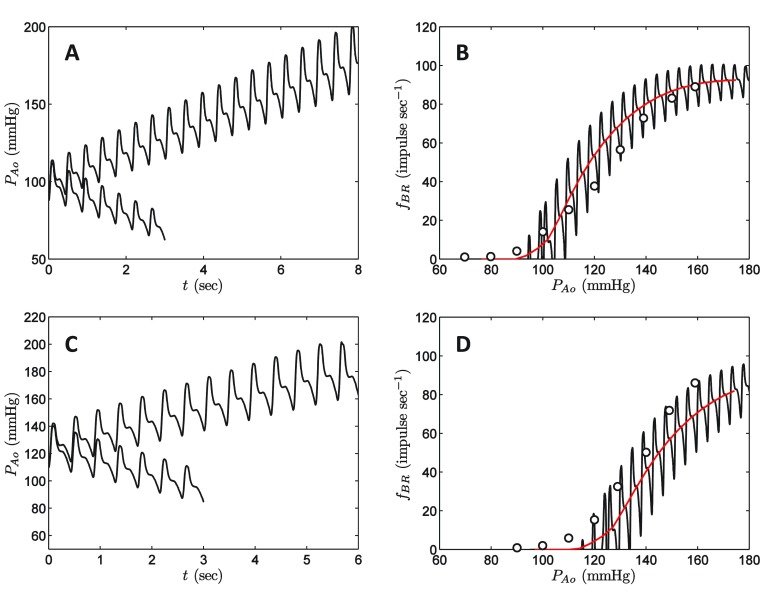
Figure 3. Baroreflex response to in vivo pressure ramps.
A. Applied pressure transients for increasing and decreasing pressure starting at a baseline mean pressure of 100 mmHg. Pressure is increased/decreased so that the mean pressure changes at the rate of ±10 mmHg sec -1. B. Simulated baroreceptor firing response to pressure ramps from A is compared to data from Coleridge et al. 11. C. Applied pressure transients for increasing and decreasing pressure starting at a baseline mean pressure of 125 mmHg. D. Simulated baroreceptor firing response to pressure ramps from C is compared to data from Coleridge et al. 11. See text for details on simulation protocol. In B and D, experimental data are plotted as circles; black line represents the simulation prediction; red line represents simulation predictions averaged over each heart beat.

