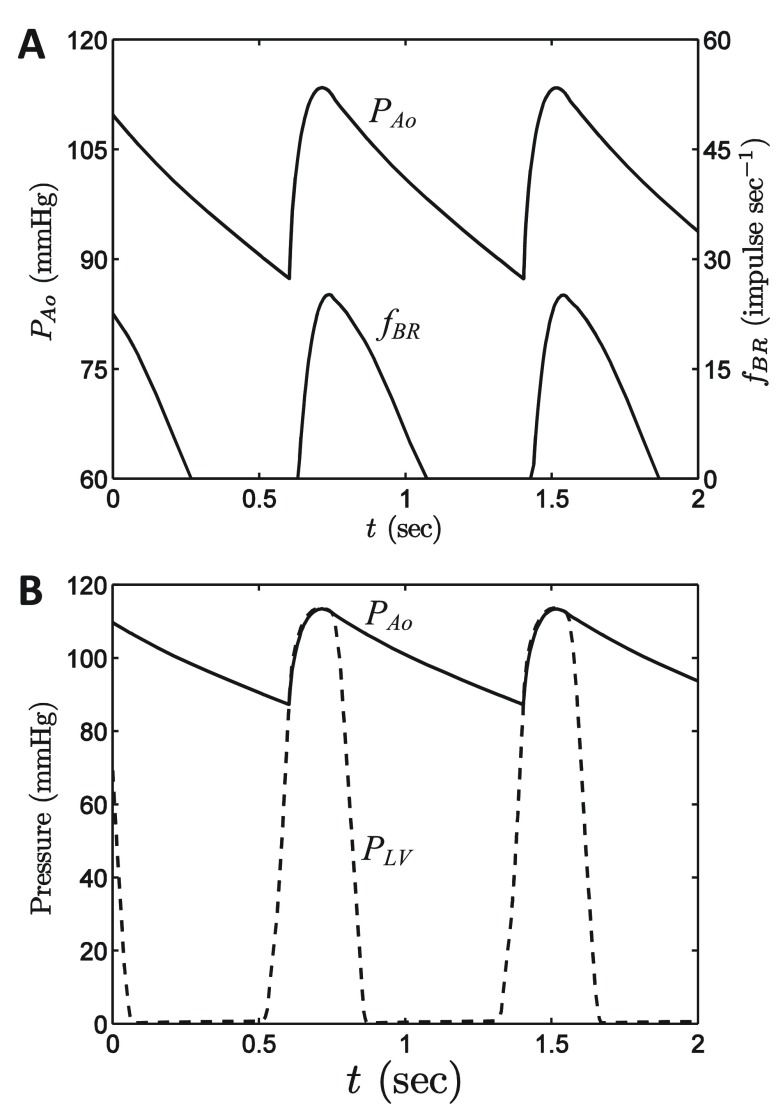
Figure 5. Baseline model operation.
A. Model-predicted aortic pressure and baroreflex firing rate, obtained with Q in = 0.5835 ml min -1. This simulation represents a period steady-state of the model, in which Q in = Q out and average pressure is 100 mmHg. B. Model-predicted aortic and left-ventricular pressures are plotted for the baseline period steady state.

