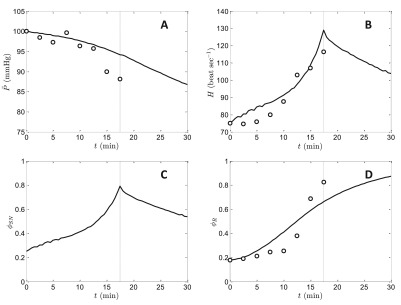
Figure 7. Simulation of system response to hemorrhage.

The experimental and simulation protocol is to withdraw blood at a rate of 2% of initial total volume per minute, starting at time 0. The end of the withdrawal period, 17.5 minutes, is indicated in by dashed line in all plots. Model simulations are compared to data for mean pressure ( A), heart rate ( B), and plasma renin activity ( D). Panel C plots the model-predicted sympathetic tone during the protocol. The initial condition is the same baseline condition used for the simulations of Figure 6. Data from heart rate, pressure, and plasma renin activity following graded blood withdrawal are from Quail et al. 18 with pressure and heart rate scaled as described in the text.
