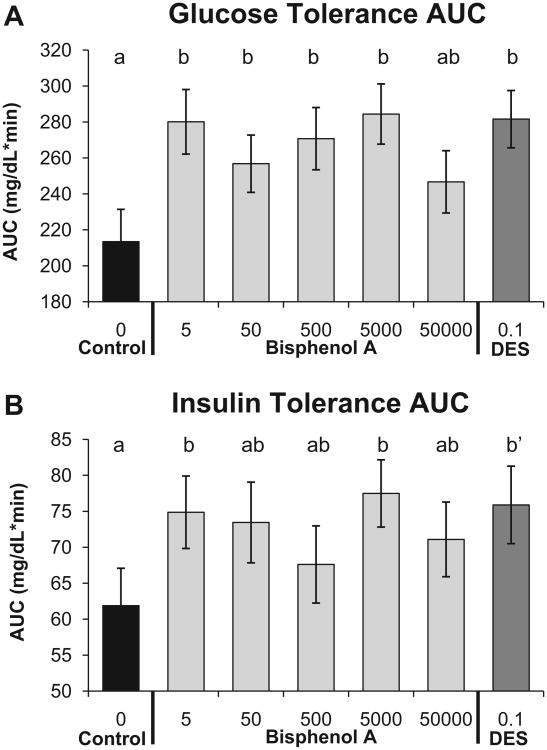
Fig. 5.
Panel A: glucose tolerance test (mean±SEM) area under the curve (AUC) after a 4-h fast in males from different prenatal treatment groups when about 18 weeks old. Blood glucose was measured during the 2 h after i.p. injection of glucose. Panel B: insulin tolerance test area under the curve (AUC) for blood glucose after i.p. injection of insulin using the same approach as for the glucose tolerance test. Groups with different letters are significantly different from each other; b′, P= 0.07 vs. controls.

