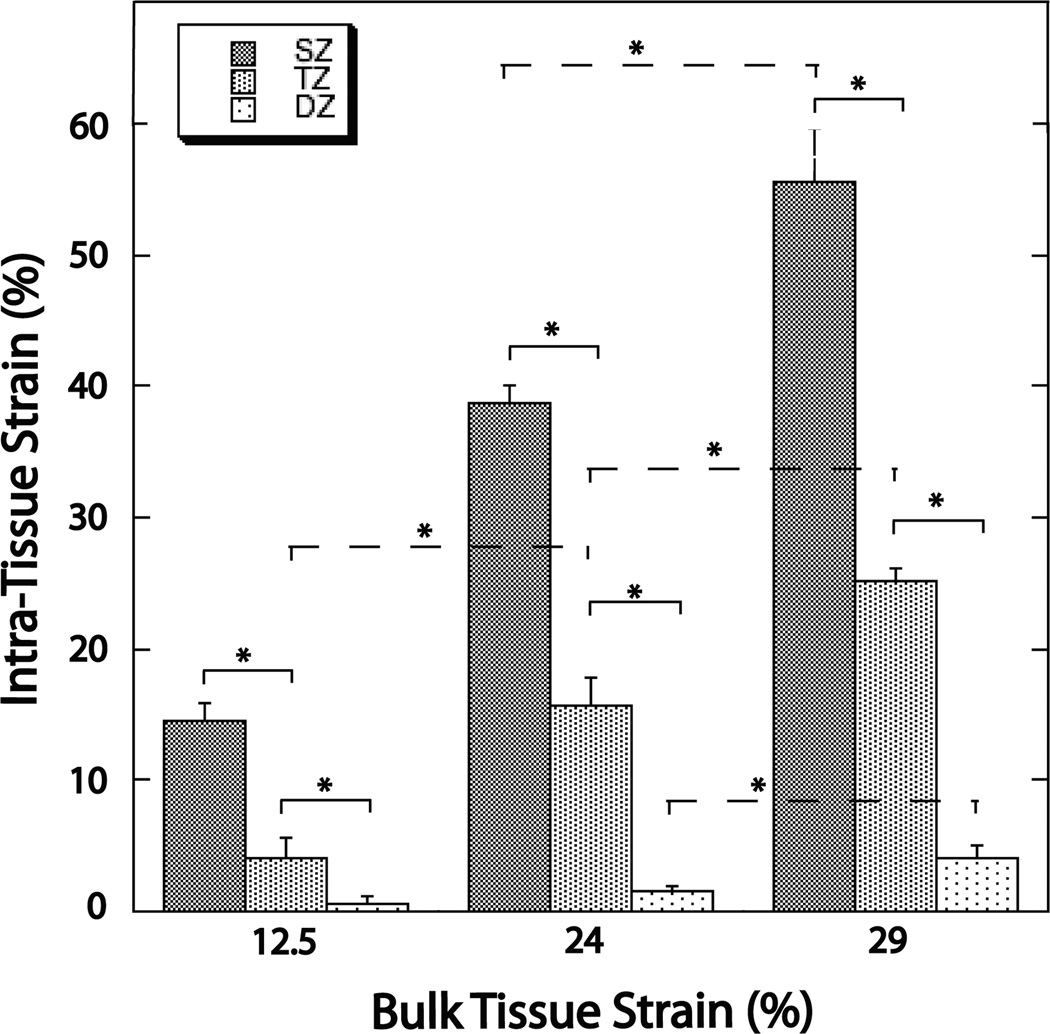
Figure 4.
Graph summarizing the depth-dependent properties of intra-tissue strain within the three bulk tissue strain levels (12.5%, 24%, 29%). Significantly decreased intra-tissue strains were seen with increasing tissue depth. Intra-tissue strains also significantly increased with increasing bulk tissue strains (although the increase in the DZ was only significant upon 29% bulk tissue strain). The * symbol indicates significance at the p < 0.05 level.

