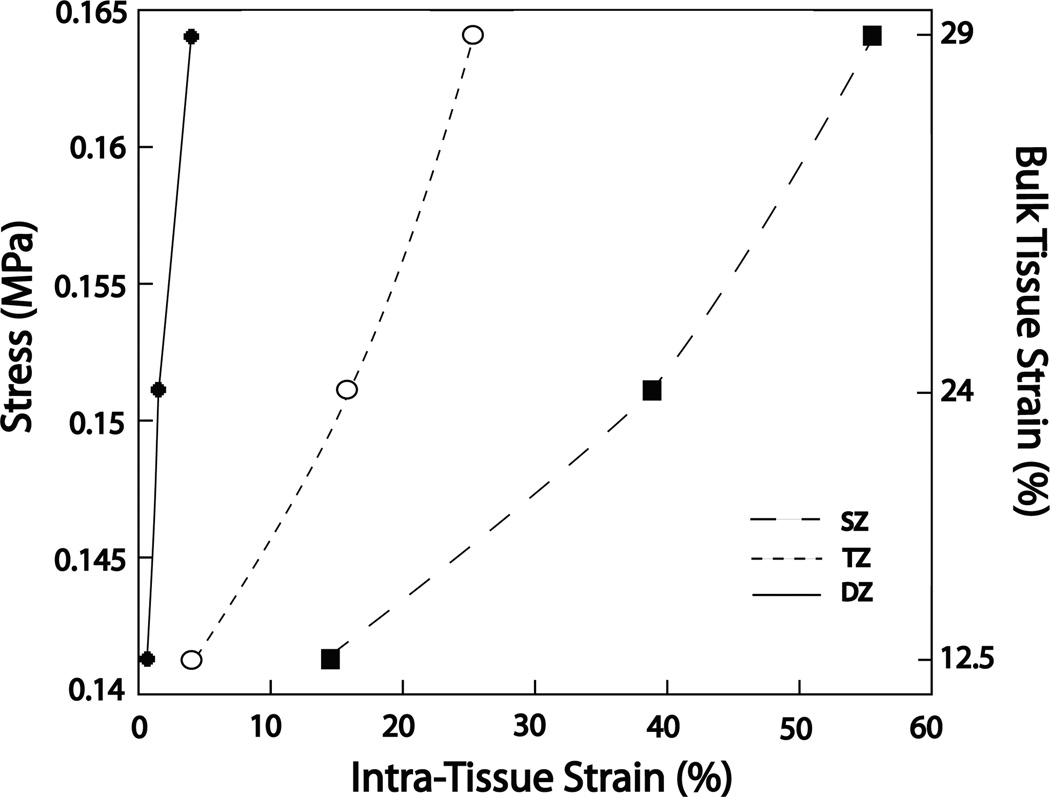
Figure 5.
Graph of bulk tissue stress against intra-tissue strain for each bulk tissue compression level. The three lines correspond to the superficial zone (SZ), transitional zone (TZ), and the deep zone (DZ). Stress increased in each zone at each bulk tissue strain level. The lines are not curve fittings and are included to provide a qualitative understanding of the differential amounts of intra-tissue strain for each zone at each level of bulk tissue strain. The increasing slopes of the lines from SZ to DZ, while not quantitative, does show that for a given stress there is decreased intra tissue strain. This may be interpreted as increased compressive resistance with increased tissue depth.

