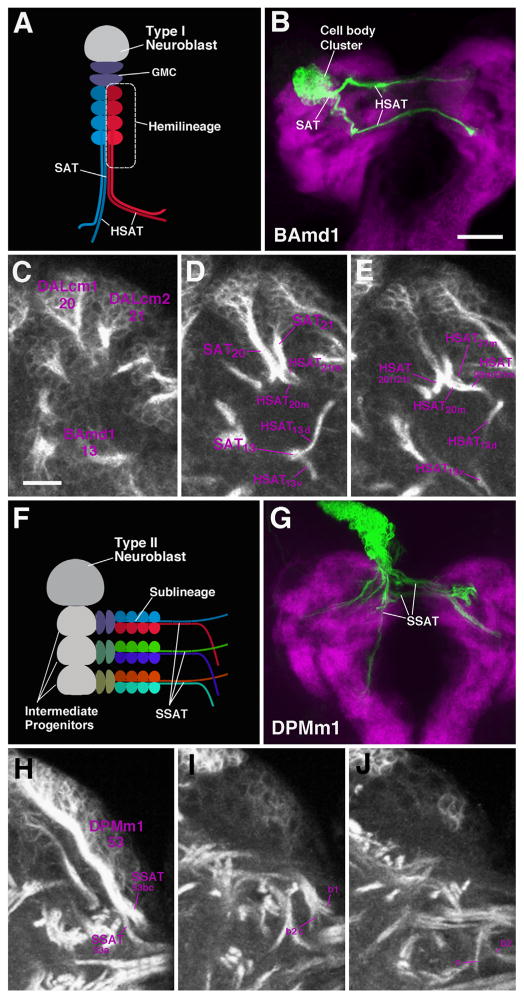
Fig. 1.
Secondary lineages form SATs during larval development. (A) Schematic representation of a Type I lineage. A single neuroblast (in grey) undergoes several rounds of asymmetric division to produce an intermediate progenitor, the ganglion mother cell (GMC, navy blue). GMCs divide to produce two post-mitotic neurons. Neuronal somata remain in close proximity to the neuroblast and extend axonal fibers as a characteristic bundle (secondary axon tract, SAT) from the outer cortical region of the brain hemisphere to the inner region, the neuropil. On occasion, GMCs generate two sister populations of genetically distinct neurons, termed hemilineages, where each produces its own axon tract, HSAT (shown in red and blue in A). (B) Z-projection of frontal confocal section of a L3 MARCM neuroblast clone of the BAmd1 lineage induced during the larval period. BAmd1 contains two hemilineages where a large cell body cluster emits two fiber bundles, identifiable HSAT’s. The larval neuropil is labeled in purple with N-Cadherin. ((C)–(E)) Three Z-projections, shown at different levels of the same BP106-labeled brain hemispheres. At the level shown in C, the cell body clusters and proximal SATs of three lineages, BAmd1 (#13), DALcm1 (#20) and DALcm2 (#21) are visible. In (D), the SAT of BAmd1 splits to form two HSATs (#13d and #13v). DALcm1 (#20), and DALcm2 (#21) are two neighboring lineages, each with HSATs (#20m/21m, #20l/21l), which come so close that they can no longer be distinguished. (F) Schematic of Type II lineage. A single neuroblast divides to generate multiple intermediate progenitor cells, each capable of undergoing several rounds of asymmetric divisions. Each asymmetrically dividing progenitor cell gives rise to symmetrically dividing GMCs to produce a sub-lineage and corresponding SAT (SSAT). Each SSAT is unique in composition and represented in different colors. ((G)–(J)) The Type II lineage DPMm1 (#53), as shown by a MARCM clone in an L3 brain ((G)); neuropil, in purple, labeled with anti-N-Cadherin and with the global marker BP106 ((H)–(J)). DPMm1 contains multiple SSAT’s, all with different trajectories (note morphology of tracts #53a–c). Scale bars: 25 μm ((B) and (G)) and 10 μm ((C)–(E), (H)–(J)).

