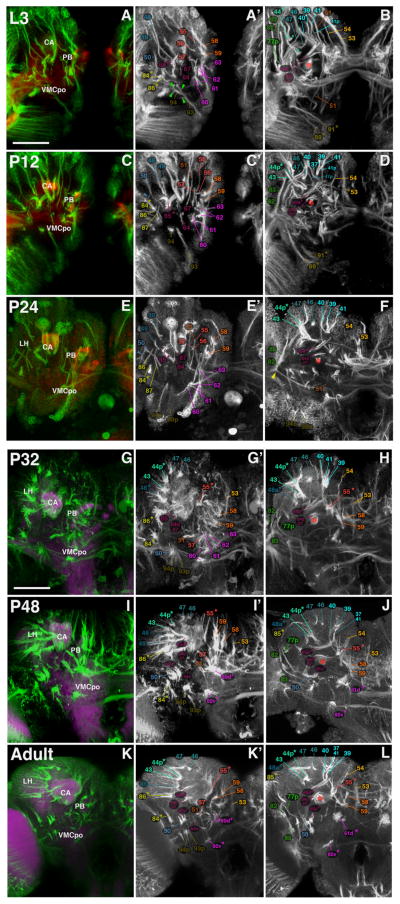
Fig. 11.
Larval-to-adult development of lineages of the posterior brain. The composition of this figure follows the same plan explained for Fig. 8, with panels of each side of this split figure arranged in three rows and three columns. Rows represent stages, indicated by at upper-left corner of A, C, E, G, I, and K. Z-projections of the first and second column (A/A′, C/C′, E/E′, G/G′, I/I′, K/K′) correspond to a posterior level (mushroom body calyx; protocerebral bridge) where SATs approach the neuropil surface. Panels of the right column (B, D, F, H, J, L) represent a “subposterior” level (posterior surface of fan-shaped body/primordium of fan-shaped body). Compartments visible at the posterior neuropil surface are annotated (white lettering, panels of left column; see Table 2 for complete listing of abbreviations). SATs and HSAT’s of individual lineages are annotated with a numerical identifier (see Table 1). Scale bar: 50 μm.

