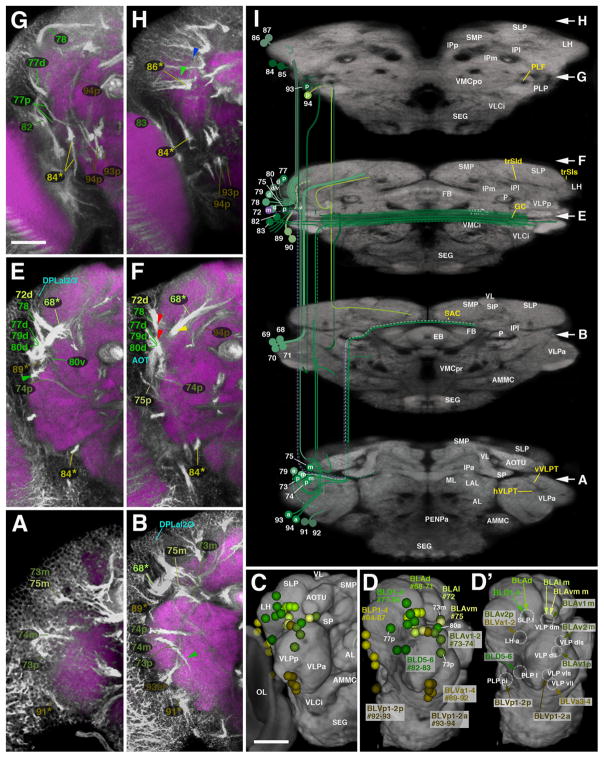
Fig. 13.
Trajectories of SATs formed by the BLA, BLD, BLP, and BLV lineage groups. The composition of this figure follows the same plan explained for Fig. 7, with sets of z-projections (A, B, E–H) illustrating segments of the SATs and fascicles at different antero-posterior levels, neuropil surface views showing location of SAT entrypoints (C–D′) and neuropil cut-away diagram depicting SAT trajectories (I). Position of A, B, and E–H along the antero-posterior axis is indicated by white arrows at the right margin of panel I. Panels C–D′ all show antero-lateral view of right brain hemisphere. In D and D′, the optic lobe (OL) is removed from volume rendering of neuropil to gain clearer view of BLP and BLV lineage entry points. White lettering in C and I annotates neuropil compartments; hatched circles and white lettering in D′ indicates SAT entry portals; yellow lettering in I indicates fascicles (for alphabetical list of abbreviations, see Table 1). Scale bars: 25 μm ((A), (D)–(F)); 50 μm ((B) and (C)).

