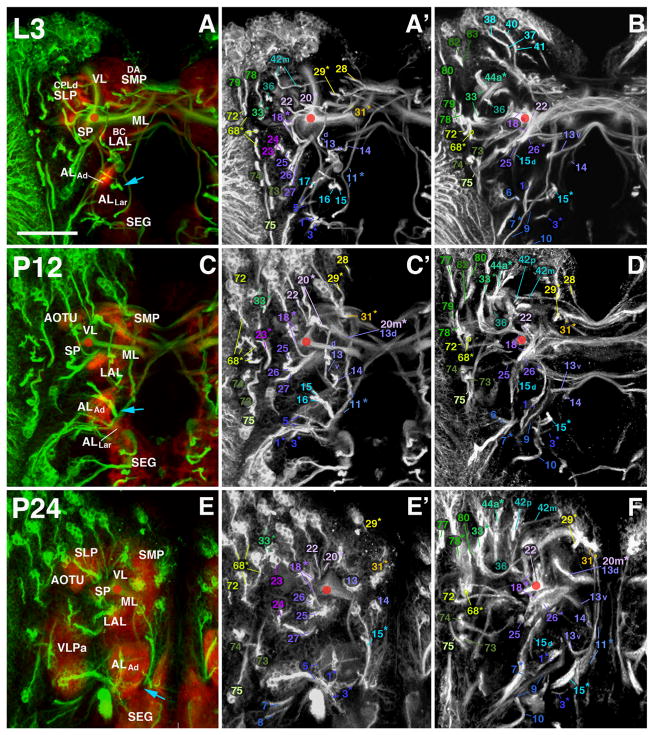
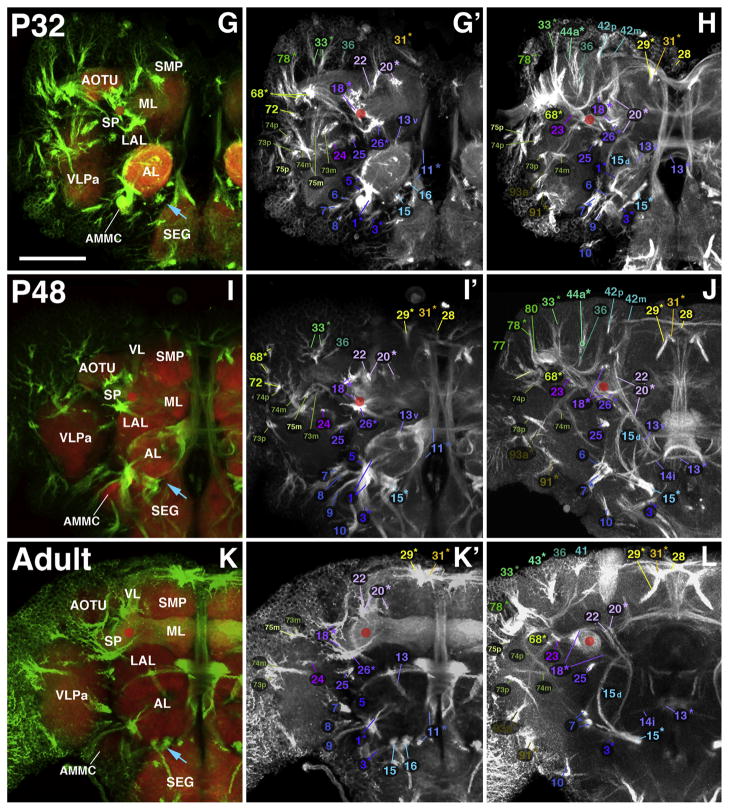
Fig. 8.
Larval-to-adult development of lineages of the anterior brain. Panels of each side of this split figure are arranged in three rows and three columns. Each row represents one stage, indicated at the top-left corner (L3, A–B; P12, C–D; P24, E–F; P32, G–H; P48, I–J; Adult, K–L). All panels show z-projections of contiguous confocal sections of a brain hemisphere labeled with BP106 or BP104 and N-Cad, representing brain slices of 15–20 μm thickness. Z-projections of the first and second column (A/A′, C/C′, E/E′, G/G′, I/I′, K/K′) correspond to an anterior level (mushroom body lobes). Both BP104-labeling (secondary neurons, SATs and fascicles; green) and N-Cad labeling (neuropil; red) is shown in left panels; middle panels show BP104 labeling only (white; A′, C′, E′, G′, I′, K′). Panels of the right column (B, D, F, H, J, L) represent a “subanterior” level (ellipsoid body/primordium of ellipsoid body). Compartments visible at the anterior neuropil surface are annotated (white lettering, panels of left column; see Table 2 for complete listing of abbreviations). SATs and HSATs of individual lineages are annotated with a unique numerical identifier (see Table 1). Numbers followed by an asterisk indicate tracts formed by more than one SAT (typically two SATs) which cannot be followed separately. For example, “20*” stands for “20 and 21”. Lower case letters (‘a,’ ‘d,’ ‘i,’ ‘m,’ ‘p,’ or ‘v’) indicate HSATs formed by individual hemilineages within a particular lineage. The red circle in each panel marks the location of the peduncle. The blue arrow in (A), (C), an d (E) marks the entry point for the SATs of BAmv1/2. Scale bar: 50 μm.


