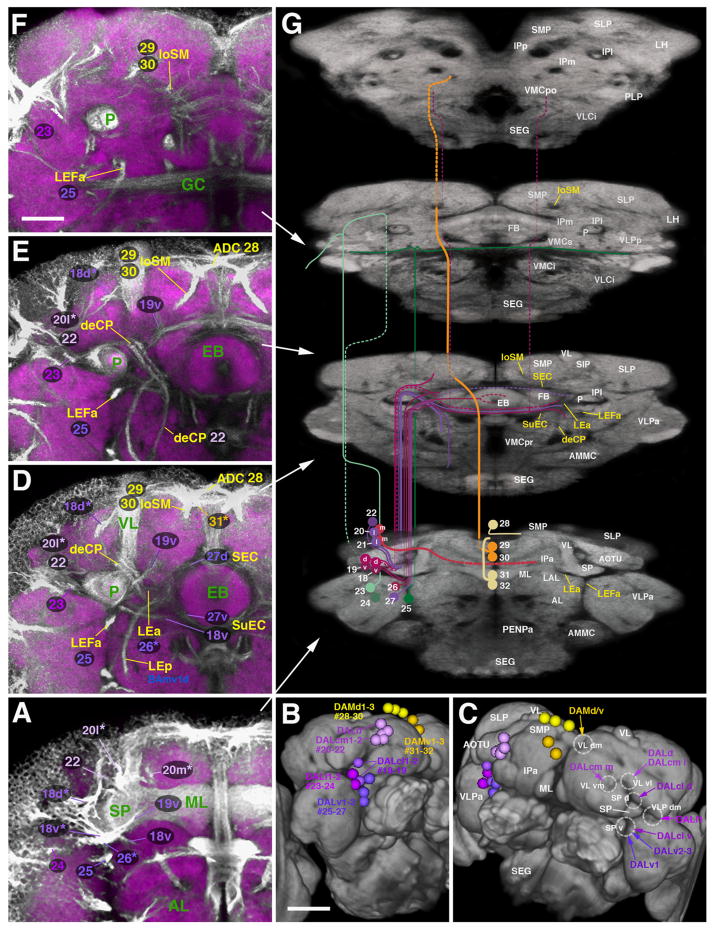
Fig. 9.
Trajectories of SATs formed by the DAL and DAM lineage groups. The composition of this figure follows the same plan explained for Fig. 7, with sets of z-projections ((A), (D)–(F)) illustrating segments of the SATs and fascicles at different antero-posterior levels, neuropil surface views showing location of SAT entrypoints ((B) and (C)) and neuropil cut-away diagram depicting SAT trajectories (G). Note that some of the panels on the left ((E) and (F)) do not show the same z-projections as those depicted in Fig. 7 (e.g. E represents a level on slightly posterior to that shown in (D); (F) corresponds to the fan-shaped body/great commissure level, see white arrows pointing out antero-posterior levels of the z-projections). Panels B and C show antero-lateral view of right hemisphere (B) and dorsal antero-lateral view of both hemispheres (C). White lettering in C and G annotates neuropil compartments (left side of C) and SAT entry portals (right side of G); yellow lettering in G indicates fascicles (for alphabetical list of abbreviations, see Table 1). Scale bars: 25 μm ((A), (D)–(F)); 50 μm ((B) and (C)).

