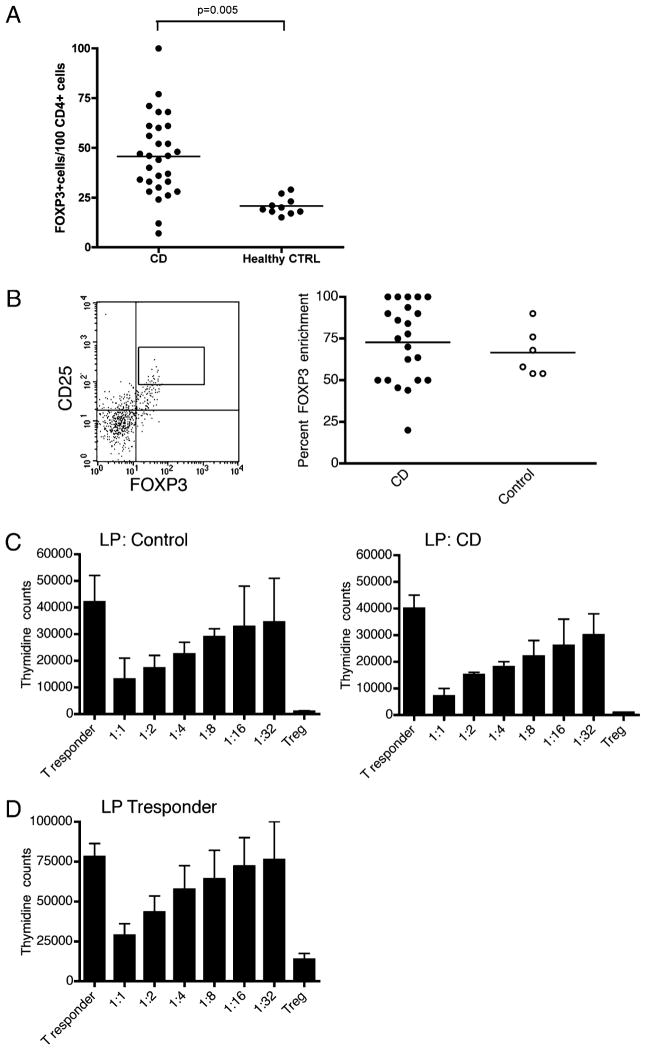
FIGURE 1.
Increased FOXP3+ Treg cells in the LP of patients with CD maintain normal suppressive capacity. A, Mean number of FOXP3+ T cells per 100 CD4+ T cells is increased in the LP of patients with CD compared with normal colonic mucosa (45.7 ± 20.2 versus 20.7 ± 4.4; p = 0.005). B, FACS analysis reveals CD4+CD25++ LP T cells to be enriched for the expression of FOXP3 in both patients with CD (n = 22) and healthy control subjects (n = 6). The dot plot on the left is a representative example of FOXP3 and CD25 staining among CD4+ cells isolated from the LP of a CD patient. The inset box represents the gate upon which cells are sorted. Aliquots of sorted cells are then stained for FOXP3, demonstrating consistent FOXP3 enrichment (right panel, CD mean/SE, 72.8% ± 5.0, and control, 66.67% ± 5.9). C, In health and in the setting of CD, LP Treg cells suppress a common T responder population. Presented are the mean and SD of thymidine counts collected from three consecutive healthy subjects or patients with CD. Individual experiments were performed in triplicate, and the combined means/SEs for all three patients are demonstrated. D, T responder cells isolated from the LP of patients with active CD can be suppressed by control Treg cells. Presented are the mean and SD of thymidine counts collected from four consecutive patients with CD. Individual experiments were performed in triplicate, and the combined means/SEs for all three patients are demonstrated in D.

