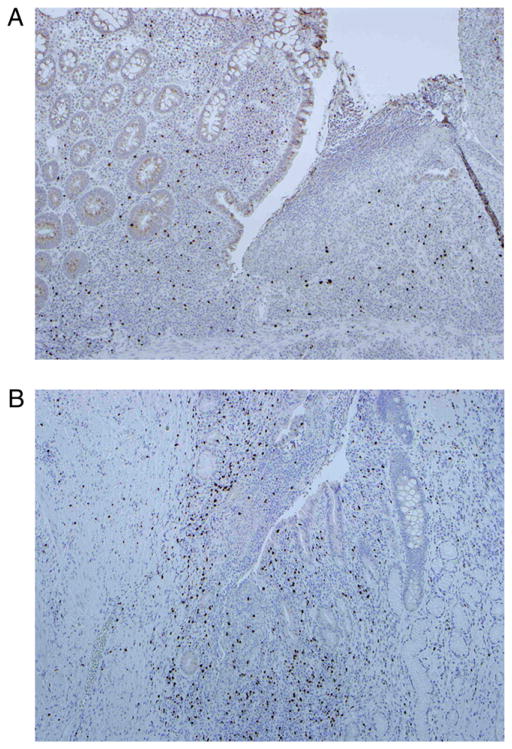
FIGURE 3.
Representative section of immunohistochemistry for FOXP3+ lymphocytes demonstrates a paucity of FOXP3+ T cells (brown stain) in a patient homozygous for NOD2 variation (Leu1007fsincC) (A) when compared with a patient with wt genotype (B) (original magnification ×10, brown stain represents anti-FOXP3).

