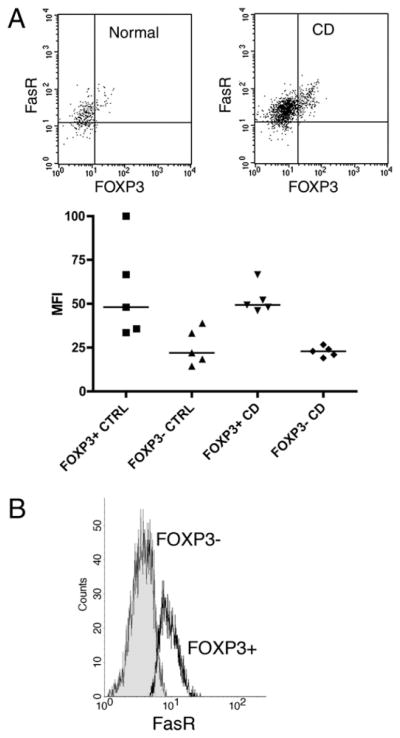
FIGURE 7.

FOXP3+ LP and peripheral Treg cells demonstrate high-level expression of the Fas receptor. A, FACS performed on LP CD4+ T cells stained for Fas receptor and FOXP3 reveals significantly greater Fas receptor expression in FOXP3+ cells as compared with FOXP3− cells. A representative dot plot demonstrates high-level expression of the Fas receptor in FOXP3+ cells in both normal patients (left dot plot) and patients with CD (right plot). Below, the mean fluorescent intensity demonstrates consistency of this observation across five consecutive normal subjects and patients with CD. B, FACS performed on peripheral CD4+ T cells stained for Fas receptor and FOXP3 reveals significantly greater Fas receptor expression in FOXP3+ cells (open histogram) as compared with FOXP3− cells (closed histogram). CTRL, control.
