
Figure 6.
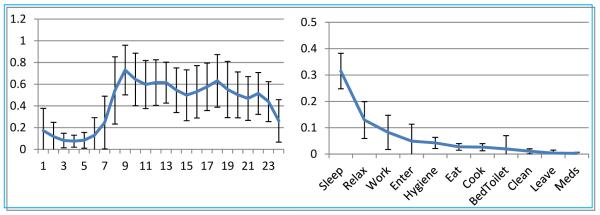
Plot of relative activity level as a function of the hour of the day (left) and relative activity duration as a function of the activity class (right).
Official websites use .gov
A
.gov website belongs to an official
government organization in the United States.
Secure .gov websites use HTTPS
A lock (
) or https:// means you've safely
connected to the .gov website. Share sensitive
information only on official, secure websites.
Plot of relative activity level as a function of the hour of the day (left) and relative activity duration as a function of the activity class (right).