Figure 6.

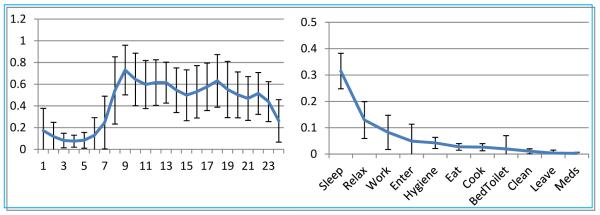
Plot of relative activity level as a function of the hour of the day (left) and relative activity duration as a function of the activity class (right).

Plot of relative activity level as a function of the hour of the day (left) and relative activity duration as a function of the activity class (right).