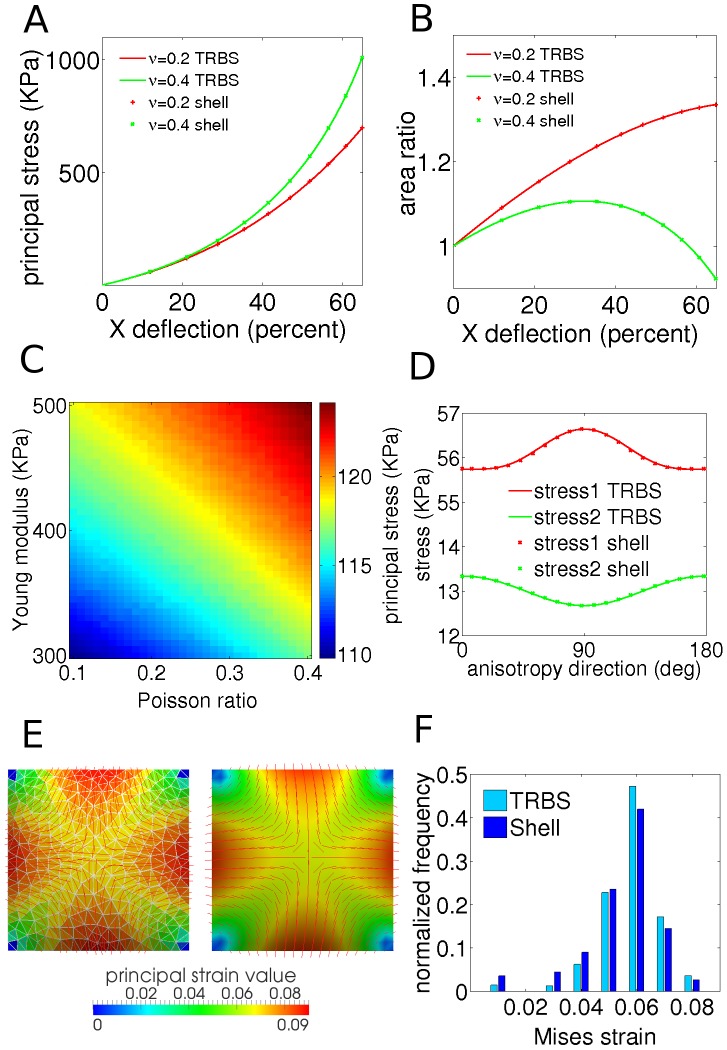
Figure 2. Comparing triangular biquadratic springs and finite element shell models.
(A, B) Uniaxial stretching test on a quadrilateral patch shows prefect agreement within numerical accuracy between both methods for principal stress and area ratio versus deflection of top right corner of the quad. Isotropic material (Young modulus = 400  , Poisson ratio = 0.2 and 0.4, thickness = 0.01
  , size = 1
  , force = 8
  ). (A) Principal stress. (B) Area ratio. (C) Principal stress value for isotropically loaded patch with
  force for the same patch using TRBS method where Young modulus and Poisson ratio were varied. The difference between principal stress value in TRBS method and integrated principal stress over thickness in FEM shell model is less than 0.1% (Figure S1A). (D) First and second principal stress values for the same patch of anisotropic material with transverse and longitudinal Young modulus of 400 and 800
  respectively and Poisson ratio of 0.2, under 0.8
  and 0.2
  anisotropic loading force. The anisotropy direction was varied between 0 deg (maximal force direction) and 180 deg. (E, F) Bending test results from pressurizing a patch of elements. (E) Principal stress direction and principal strain value for TRBS (left) and shell (right). The material is isotropic with Young modulus 400
  and Poisson ratio 0.2. Number of elements is 400 and 250 for shells and TRBS, respectively. (F) Distribution of equivalent Mises strain value over elements. TRBS elements show slightly higher strain values because of the lack of bending energy. Average equivalent Mises strain over elements: 0.0527 and 0.0492 for TRBS and shell, respectively.

