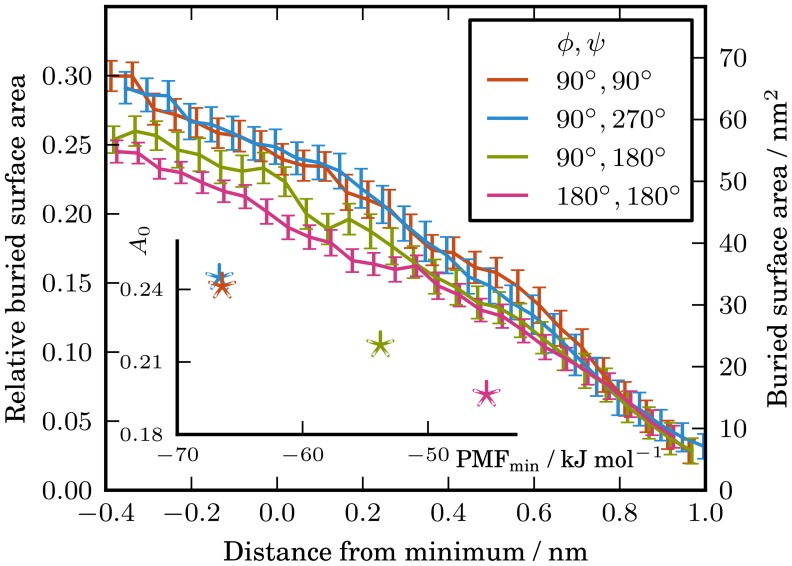
Figure 4. Buried surface area of the protein complex as a function of distance from the minimum of the PMF.
The error bars correspond to  . The inset figure shows the relative buried surface areas at the minimum of the respective PMFs as a function of the restrained global minimum PMF depth. The buried surface areas at the minimum of the PMFs were obtained from a straight line fit of the region
  from the minimum of the PMF.

