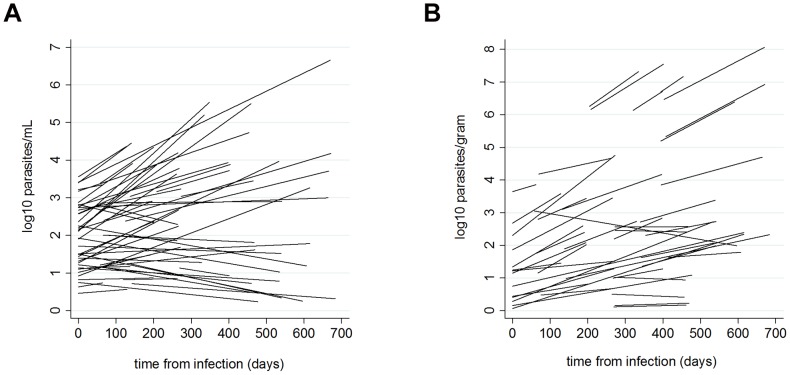
Figure 3. L. infantum parasite load model fits for individual dogs with time from infection.
Lines represent fitted slopes of log10 parasite loads in (A) bone marrow (per mL) and (B) ear skin (per gram) examined using a multilevel mixed-effects time series model with random intercepts (initial loads) and slopes (parasite loads with time).

