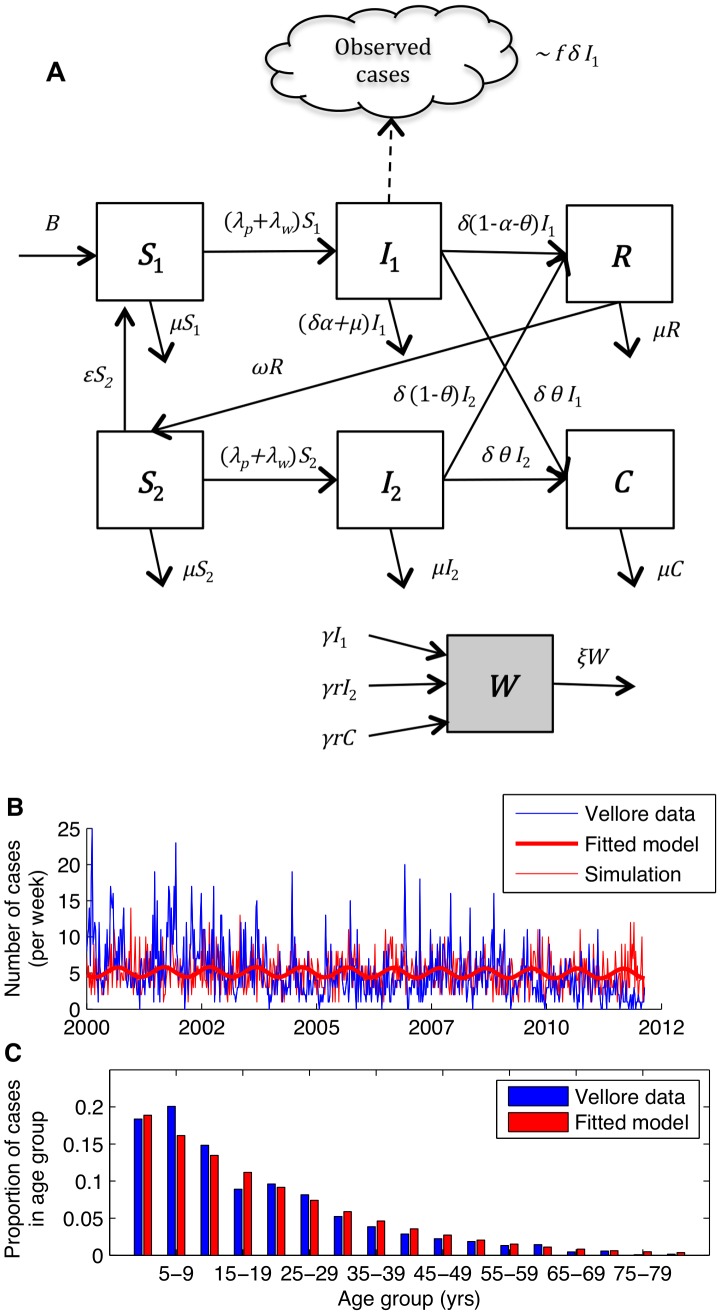
Figure 1. Model for the transmission dynamics of typhoid.
(A) Diagram of model structure. Model parameters are defined in Table 1. (B) Weekly incidence of observed (blue line) and model-predicted (thick red line) typhoid inpatients at Christian Medical College hospital in Vellore, India. The thin red line represents a simulated incidence time-series for the best-fit model assuming the number of cases each week is Poisson distributed with a mean equal to the model-predicted incidence. (C) Age distribution of observed (blue) and model-predicted (red) typhoid cases.

