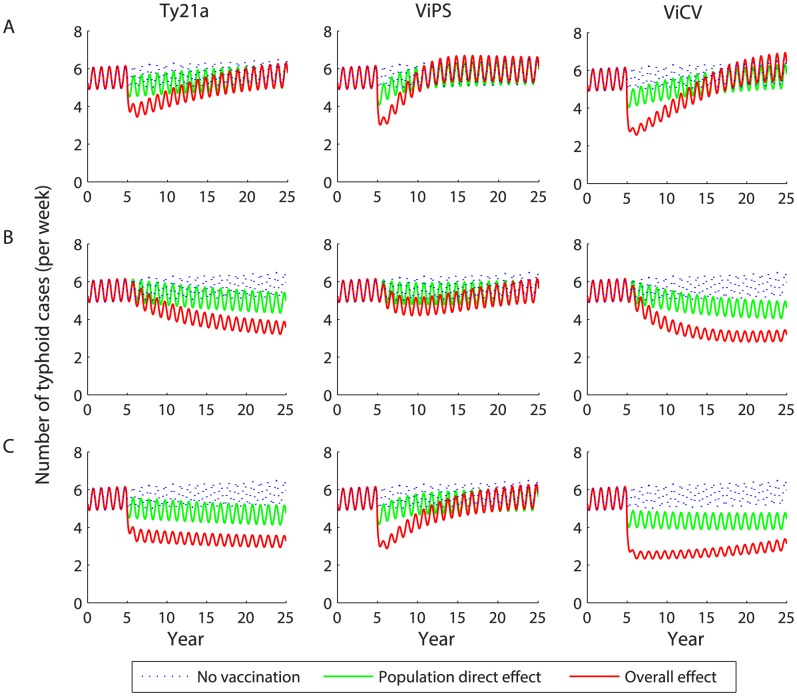
Figure 3. Predicted impact of vaccination on the weekly incidence of typhoid.
Vaccination is introduced in year 5 with 80% coverage as (A) a one-time campaign among 6–15 year olds, (B) routine vaccination of 6 year olds, or (C) routine vaccination of 6 year olds plus a one-time catch-up campaign among 6–15 year olds. The red line represents the model-predicted overall effect of vaccination, while the green line represents the population direct effect of vaccination and the dotted blue line is the projected typhoid incidence in the absence of vaccination.

