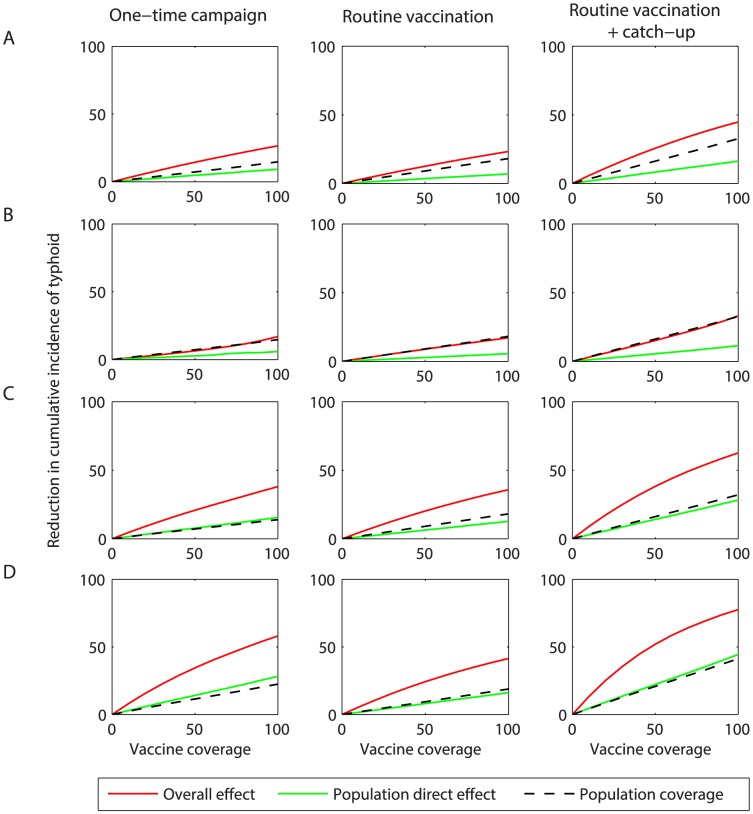
Figure 4. Overall effect of vaccination on the projected incidence of typhoid over the first 10 years following vaccine introduction.
The model-predicted reduction in the cumulative incidence of typhoid at coverage levels ranging from 0 to 100% is plotted for vaccine-induced immunity and efficacy assumptions corresponding to (A) the Ty21a live oral vaccine, (B) the Vi-polysaccharide (ViPS) vaccine, and (C) the Vi-conjugate (ViCV) vaccine administered at 6 years of age or (D) 9 months of age. The red line represents the model-predicted overall effect of vaccination, while the green line represents the population direct effect of vaccination. The dotted black line represents the population coverage (i.e. the proportion of the population ever vaccinated).

