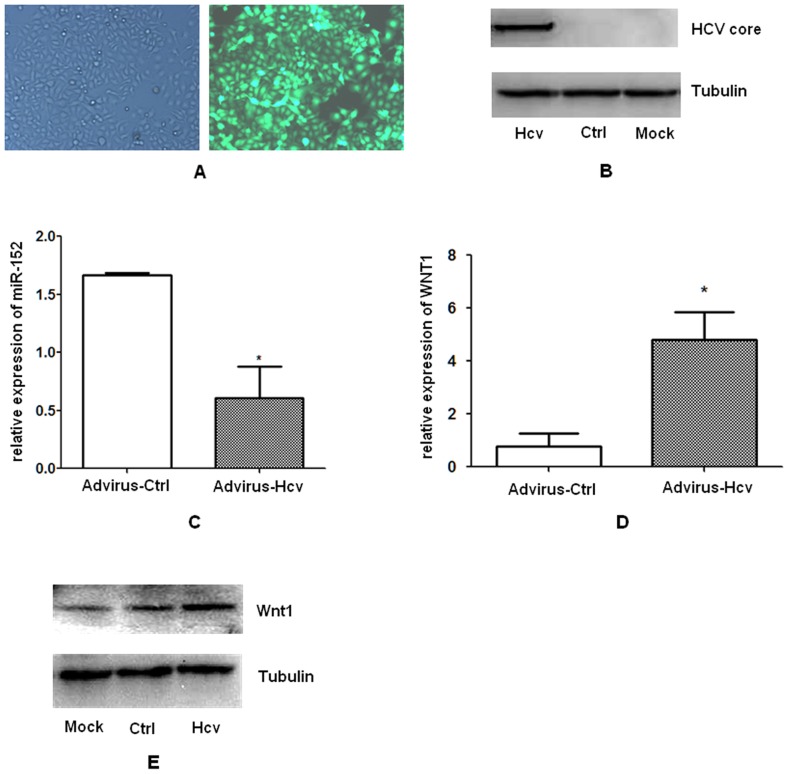
Figure 1. Over-expression of the HCV core protein down-regulated miR-152 expression and up-regulated Wnt1 expression.
HepG2 cells were mock infected, or infected with Ad-HCV core or Ad-EGFP for 48 h, and were harvested for preparation of total RNA and protein. (A) Infection efficiency of the adenovirus observed under the fluorescent microscope (×10). (B) Western blot analysis for HCV core protein expression. (C) SLqRT-PCR analysis for miR-152 expression. After normalization to endogenous RNU6B expression, the expression of miR-152 in each group of HepG2 cells was expressed as fold changes in comparison to the levels observed in mock-infected HepG2 cells. (D) Real time RT-PCR analysis for Wnt1 mRNA expression. (E) Western blot analysis for Wnt1 protein expression. Data are shown as means and standard deviations from triplicate experiments. * P<0.05. (HepG2: mock-infected HepG2 cells; Hcv: HepG2 cells infected with the Ad-HCV core; Co: HepG2 cells infected with the Ad-EGFP control; Advirus-Hcv: Adenovirus expressing the HCV core protein, Ad-HCV core; Advirus-Ctrl: Adenovirus expressing the EGFP control protein, Ad-EGFP).

