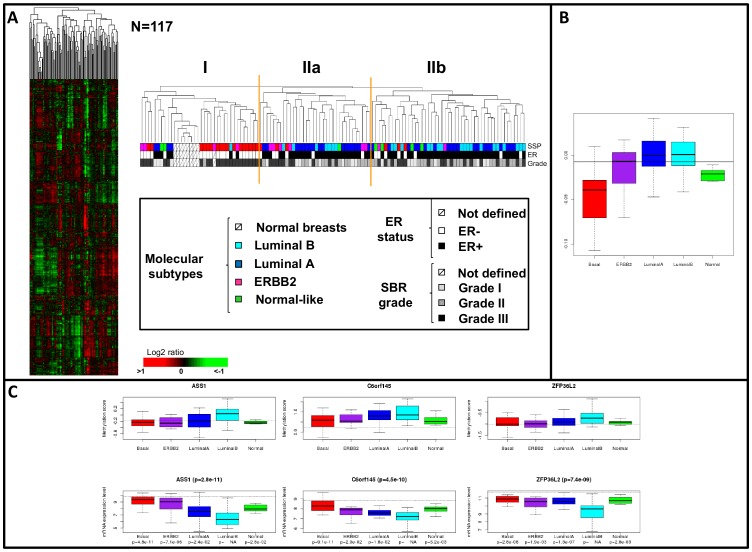
Figure 4. DNA Methylation promoter profiles in breast cancers.
A- Hierarchical clustering established with the most variant methylation scores observed in 5,492 gene promoters (SD>0.3) in 109 tumors samples and 8 normal breast tissues samples. Each row of the data matrix represents a gene promoter and each column represents a sample. DNA methylation variations are depicted according to the color scale shown at the bottom. Red indicates increased DNA methylation score and green indicates decreased DNA methylation score. The dendrogram of samples (above matrixes) represents overall similarities in DNA methylation profiles and is zoomed to the right. Three groups of tumor samples (I, IIa and IIb) are associated with various DNA methylation patterns and delimited by orange vertical lines. Below the dendrogram are some histoclinical and molecular features of the samples: from top to bottom, intrinsic molecular subtypes4, IHC ER status and SBR grade. Color legends for the various features are illustrated below. B - The median methylation levels of the 4,545 subtype-associated genes were highest in the luminal and ERRB2 subtypes and lowest in the basal subtype (p = 6.24 10−12). C - Compared to the other molecular subtypes, the DNA methylation levels (three top panels) of ASS1, C6ORF145 and ZFP36L2 gene promoters and their mRNA expression (three bottom panels) were higher (Table S4E) and lower in the luminal B BCs, respectively.

