
Figure 6. Exposure time of mosses to nitrogen increases non-linearly at increasing nitrogen concentrations.
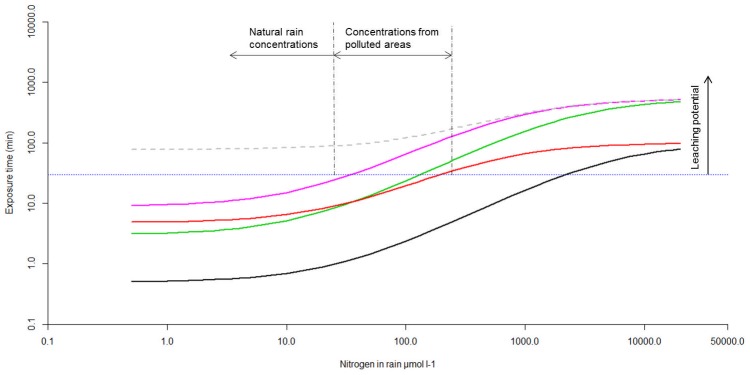
We used a conceptualized relationship (log-log) between nitrogen concentration in rain and exposure time for a living Sphagnum layer that would need to retain some 90% of the nitrogen load. The area below the horizontal dots (average residence time of rain) indicates an increasing potential of nitrogen leaching through the living layer of mosses. Maximum uptake rates Vmax differ between scenarios: black “ammonium pulse” 28 µmol N gDW−1 h−1, green “ammonium long” 2.8 µmol N gDW−1 h−1, red “nitrate pulse” 2.5 µmol N gDW−1 h−1, purple “nitrate long” 0.8 µmol N gDW−1 h−1 and grey dashed line “nitrate low affinity” 0.8 µmol N gDW−1 h−1, respectively. The model was parameterised with a Km of 6.5 µM for ammonium and a Km of 3.5 µM for nitrate. The “nitrate low affinity” was calculated with a Km of 35 µM. An increasing potential of leaching is expected above the dotted black line that indicates the upper limit of residence time of rain. Average nitrogen concentrations in rain (µmol N l−1) relate to yearly wet deposition of nitrogen (kg ha−1) by a factor 0.1 (yearly rainfall 750 mm).