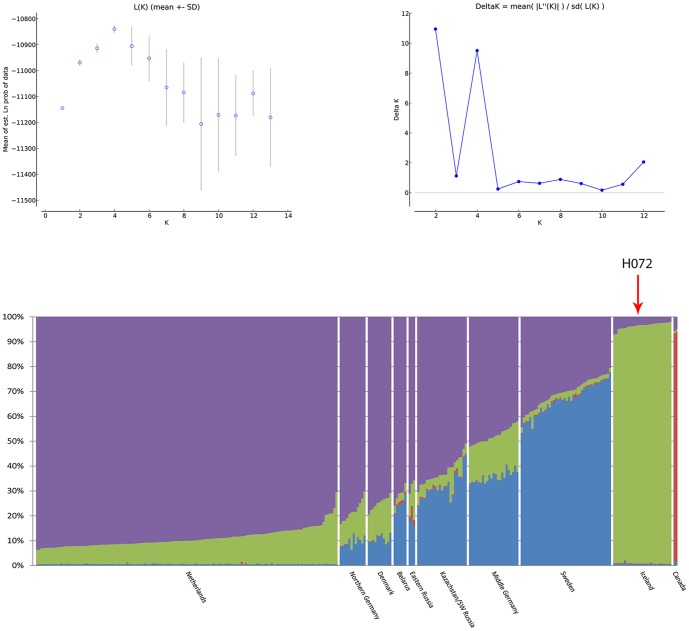
Figure 2. Mean log likelihood, DeltaK and assignment value plot of microsatellite STRUCTURE analysis.
Above: mean log likelihood Ln P(X|K) and DeltaK as a function of the number of genetic clusters (K) averaged over 5 consecutive STRUCTURE runs for each K (error bars indicate one standard deviation). Below: representation of the assignment values, estimated relative contribution of each member of the population to that individual's microsatellite-based genome, per individual at the different sample locations for K = 4. The red arrow indicates sample H072.

