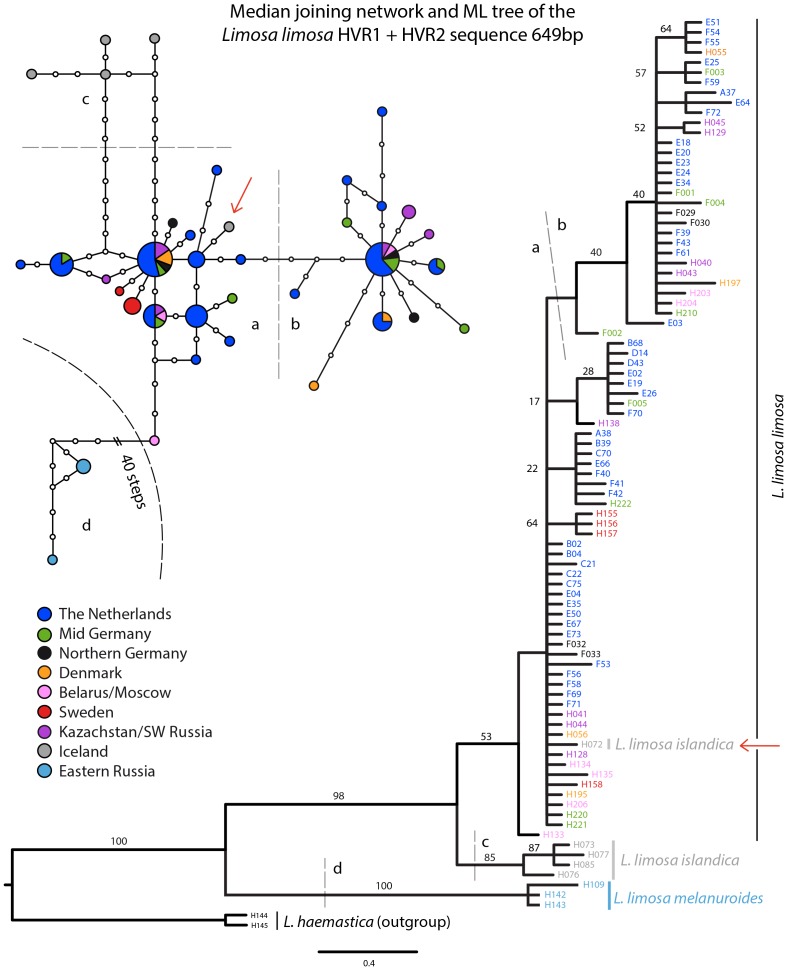
Figure 4. Maximum Likelihood tree and median joining network of the mitochondrial HVR1 and HVR2 regions.
Analysis of the mitochondrial HVR sequences for the three Limosa limosa subspecies. The colors indicate the sample locations. The support values of the maximum likelihood analysis are plotted on the respective branches. Additionally, a median-joining network of 89 HVR mtDNA sequences is depicted. Different clusters are indicated with a/b/c/d. The red arrow indicates one individual (H072) which was found on Iceland but sorted close to L. l. limosa haplotypes.

