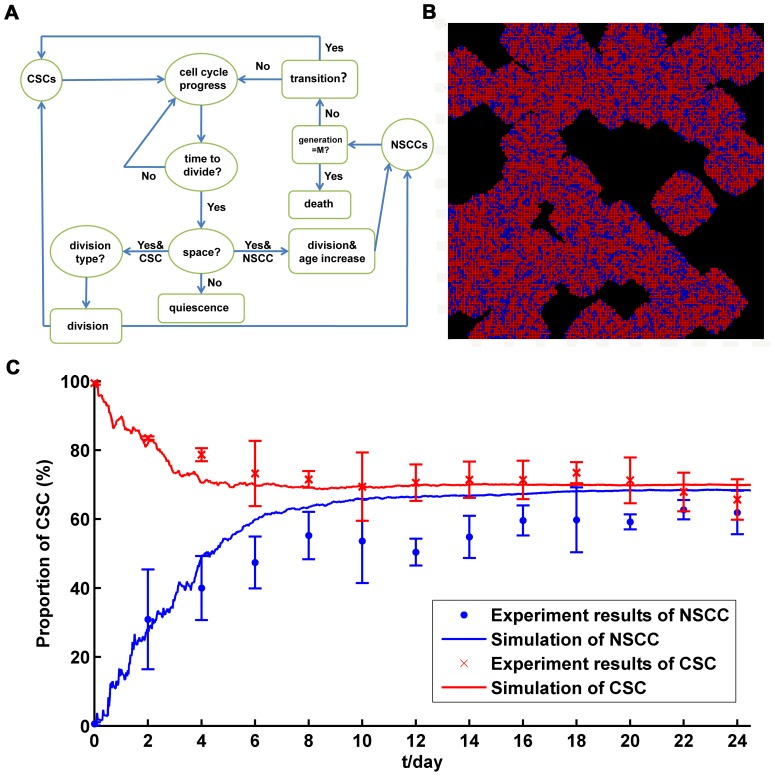
Figure 3. The long-term dynamics between CSC and NSCC subpopulations via cellular automaton simulation method.
(A). Calculation scheme for cellular automaton method. (B). Typical result of simulation with cellular automaton method (initial condition is that all the cells are NSCCs). Red: CSC; Blue: NSCC; Black: vacant lattice. (C). Comparison between simulation results with cellular automaton method and experimental results.

