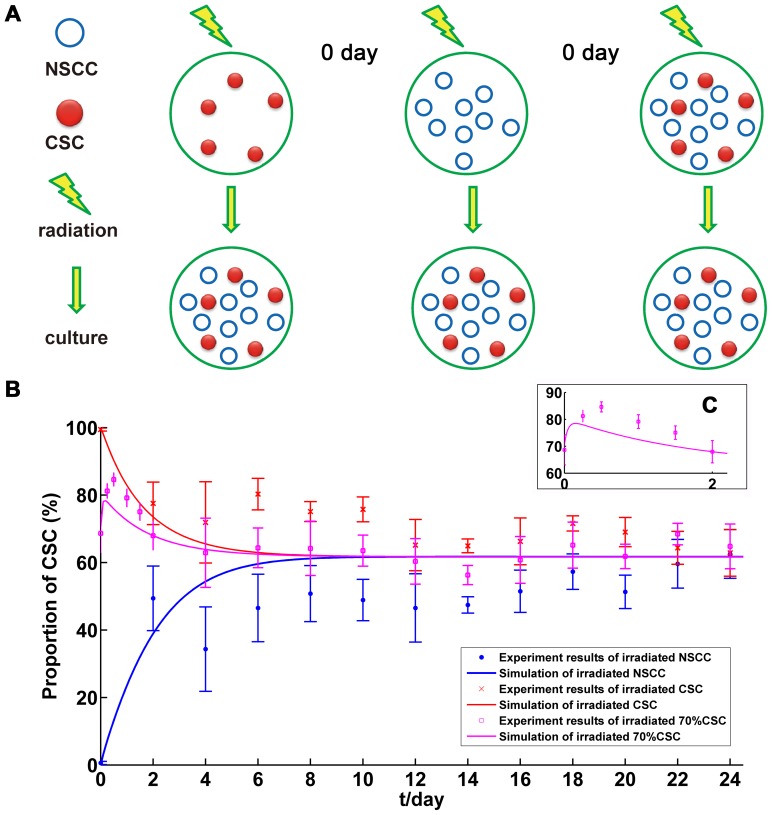
Figure 4. Radiation experiments procedures and simulations of long-term dynamics between CSC and NSCC subpopulations.
(A). Diagram of experiment procedures with radiation treatment; (B). Comparison between simulation and experiment results in 0–24 day (radiation is applied when t is 0 day); (C). Amplified image of the results from irradiated 70% CSC group (0–2d) (radiation is applied when t is 0 day).

