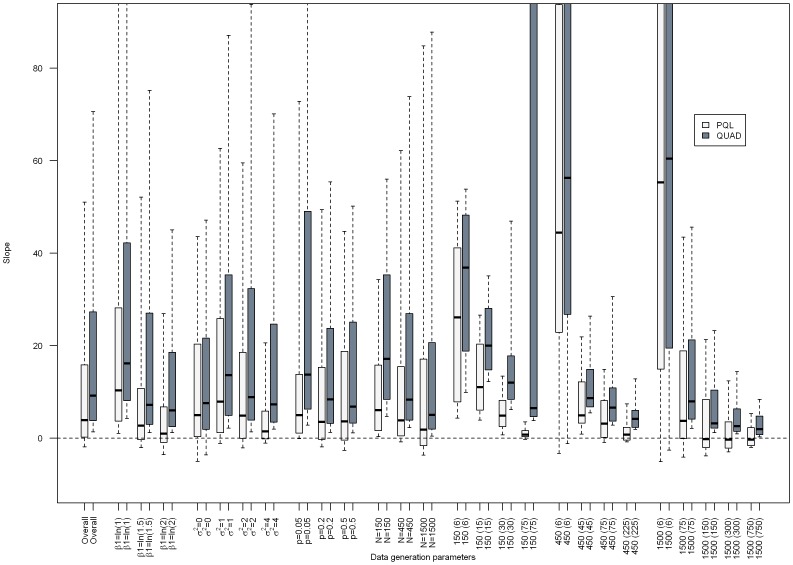
Figure 1. Boxplot depicting the slopes from separate simple linear regressions for the effect of the absolute percent difference in ORPQL and ORQUAD
 on the absolute percent bias in ORQUAD or ORPQL, respectively, overall and by data generation parameters.
Median (interquartile range) of the estimated slope is the center of the box, box edges are the 25th and 75th percentile respectively, ends of the dashed lines are the 10th and 90th percentile, respectively.

