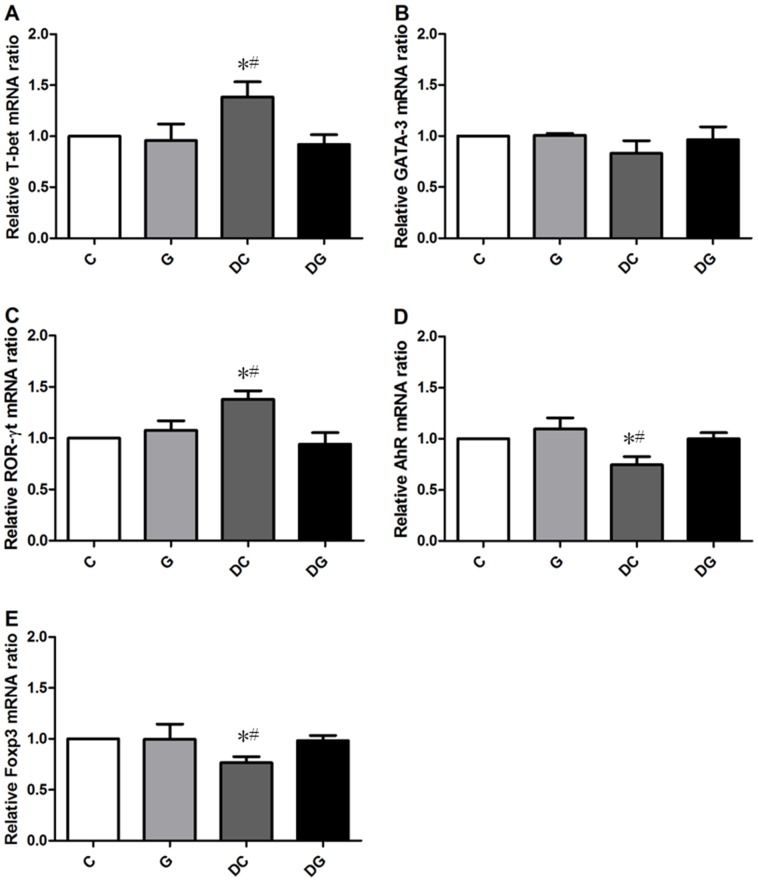
Figure 3. Transcription factor gene expressions of A) T-bet, B) GATA-3, C) ROR-γt, D) the aryl hydrocarbon receptor (AhR), and E) forhead box p3 (Foxp3) in mesenteric lymph nodes (MLNs) were analyzed by a real-time PCR.
Quantitation of mRNA changes was calculated by the comparative CT (2−ΔΔCt) method, and the mRNA expression of C mice was used as a calibrator. Data are shown as the mean ± SEM. *Significantly differs from the C group. # Significantly differs from the DG group (p<0.05).

