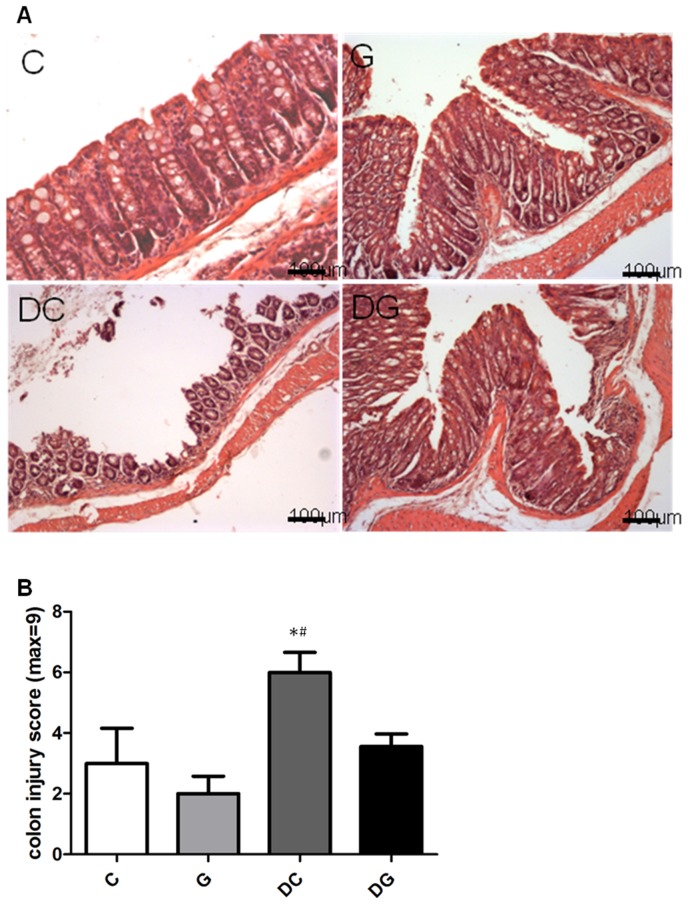
Figure 7. Histopathology of colon tissues.
A: Hematoxylin and eosin staining of colon tissues from mice in the C, G, DC, and DG groups. B: Histological scores of colitis. Data are presented as the mean ± SEM., which were determined as described in “Materials and Methods.” Differences among groups were analyzed by a one-way ANOVA using Tukey's test. *Significantly differs from the C group. #Significantly differs from the DG group (p<0.05).

