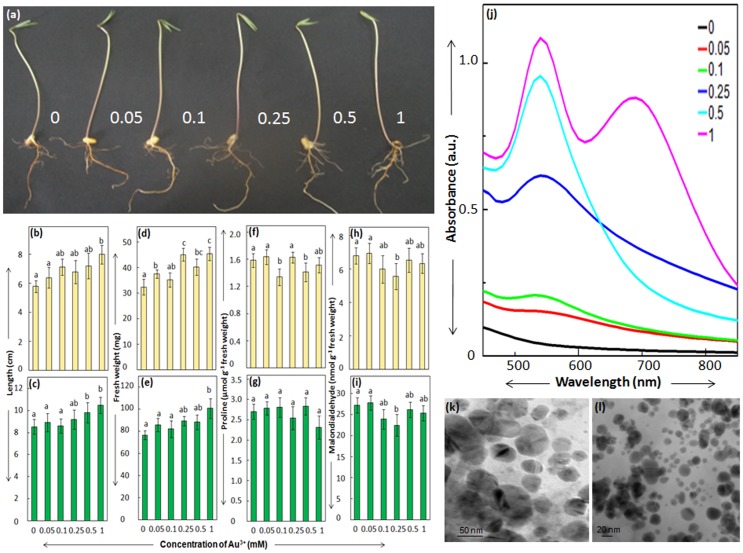
Figure 1.
Seedlings of cowpea raised in varying concentrations (mM) of Au3+ (a). Length [(b),(c)], fresh weight [(d),(e)], proline [(f),(g)] and MDA levels [(h),(i)] of root (yellow bars) and shoot (green bars) of cowpea seedlings raised in Au3+. Absorption spectra (j) and TEM images [(k),(l)] of Au3+ solutions in which seedlings were raised. Values represent mean of data collected from seven independent experiments and vertical lines on bars represent standard error [n = 35 for (b), (c), (d) & (e); n = 7 for (f), (g), (h) & (i)]. Values designated by different small letters above bars are significantly different at P≤0.05 (Duncan's multiple range test).

