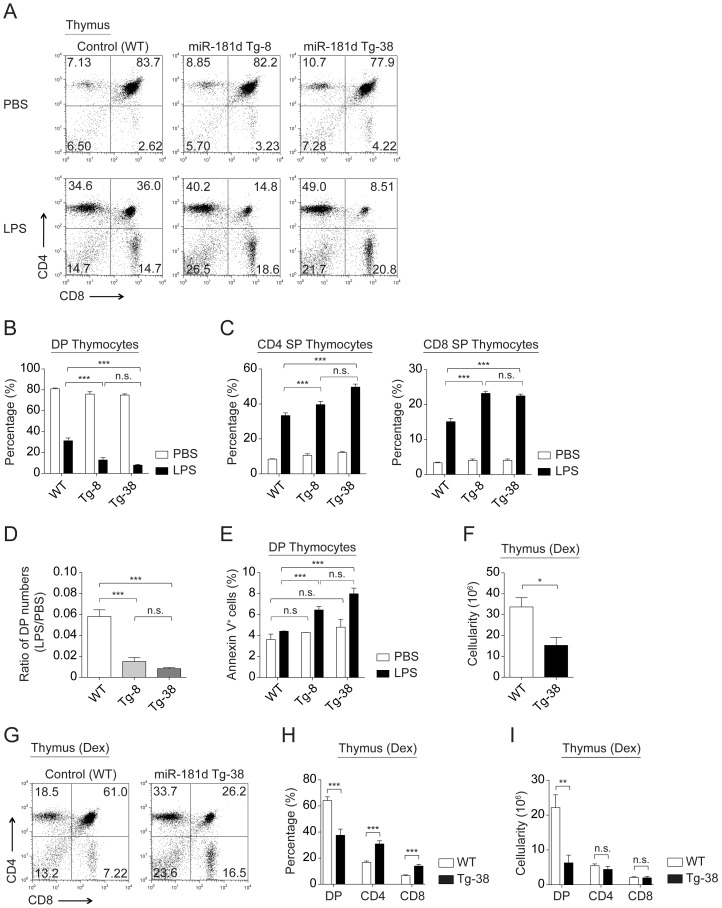
Figure 4. MiR-181d over-expression elevates stress-induced thymic atrophy.
(A) Representative plots show CD4 by CD8 profiles of total thymocytes from the control and miR-181d Tg mice at 72 hours after PBS or LPS (100 µg/mouse) injections. (B–C) Graphs demonstrate the average percentages of DP thymocytes (B), and CD4 SP and CD8 SP thymocytes (C) at 72 hours post-injection (PBS, white; LPS, black). (B–C) Data are of the mean +/− SEM from at least 4 independent experiments using at least 3 mice per injection (n.s. = non-significant, *p<0.05, **p<0.01, ***p<0.001; Two-way ANOVA followed by Bonferroni's post-hoc test). (D–E) Data were calculated from the experiments shown in the panels A and B. Each bar shows the mean +/− SEM. (D) Ratios of DP thymocyte numbers upon LPS treatment to the numbers of DP thymocytes upon PBS treatment (n.s. = non-significant, *p<0.05, **p<0.01, ***p<0.001; One-way ANOVA followed by Tukey's post-hoc test). (E) Average percentages of Annexin V+ cells gated on DP thymocytes at 72 hours post-injection (PBS, white; LPS, black). (n.s. = non-significant, *p<0.05, **p<0.01, ***p<0.001; Two-way ANOVA followed by Bonferroni's post-hoc test). (F) Total thymic cellularity in the control and miR-181d Tg-38 mice at 48 hours upon Dex injection (60 µg/mouse). (G) Representative FACS plots show CD4 by CD8 profiles of thymocytes after 48 hours post-Dex injection. (H–I) Average percentages (H) and absolute numbers (I) of thymocyte subsets following Dex treatment at 48 hours. (F–I) Bar graphs show the mean +/− SEM from at least 4 mice per treatment (n.s. = non-significant, *p<0.05, **p<0.01, ***p<0.001; Two-tailed unpaired Student's t-test).

