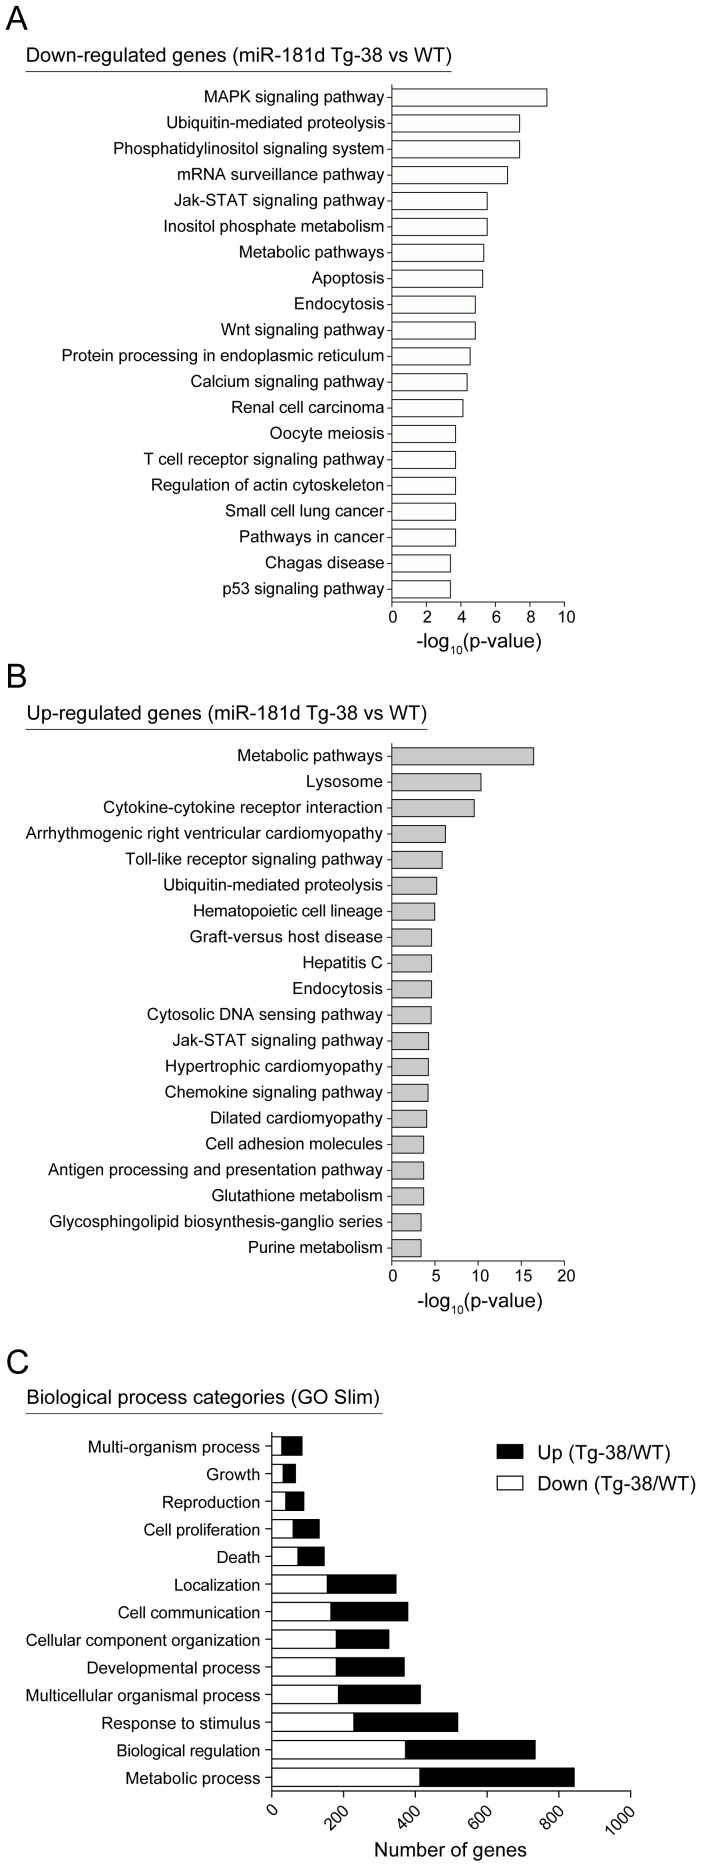
Figure 6. KEGG pathway and Gene ontology analyses of differentially regulated genes in miR-181d transgenic thymocytes.
(A–B) Top 20 over-represented KEGG pathways are shown based on the statistical significance for down-regulated (A) and up-regulated genes (B) with more than 1.2-fold (p<0.05) in the miR-181d Tg-38 thymocytes compared to the wild type control. Pathway enrichment analysis was performed using the Web-based Gene Set Analysis Toolkit. (C) Biological process categories over-represented within the dysregulated genes are shown. White and black bars are of down- and up-regulated genes in the miR-181d Tg-38 thymocytes, respectively. Gene ontology Slim (GO Slim) analysis was performed using the Web-based Gene Set Analysis Toolkit.

