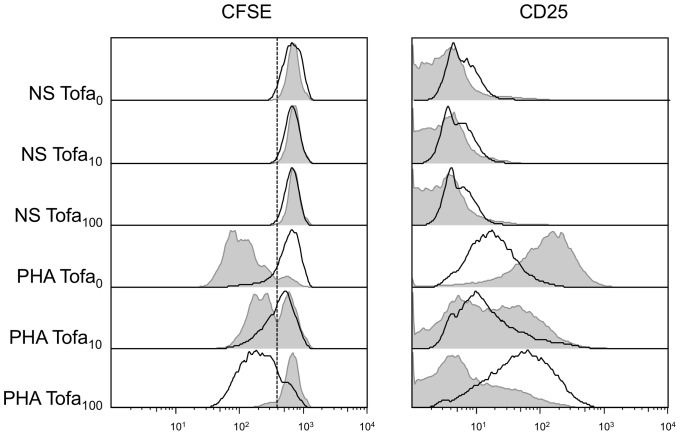
Figure 3. Representative data of cell proliferation and activation.
Cells were incubated with PHA and the two concentrations of Tofa (grey histograms); after four days the medium was removed, and the incubation continued in drug-free medium for four additional days (black line histograms). The panel on the left represents the percentage of proliferating cells based on dilution of CFSE dye. On the right expression of CD25 is reported and evaluated as MFI.

